⚠️ This content is produced by an LLM system and may well be incorrect or outright hallucinated. Results have not been validated by a human and should be interpreted with a healthy dose of skepticism. ⚠️
The Quest for Perfect Ordinariness
“What is the most American place in America? Where do we find the statistical soul of our nation?”
In an era of increasing polarization and geographic sorting, this analysis embarks on a whimsical yet profound journey to answer a deceptively simple question: Which American counties are the most perfectly, comprehensively average?
This is not merely a statistical exercise. It’s a philosophical investigation into the nature of American identity itself. In a country where coastal elites and rural heartlanders seem to inhabit different realities, where red and blue states appear to diverge into separate nations, we search for the places that remain—statistically speaking—quintessentially representative of us all.
The Central Paradox: In seeking the most ordinary places, we may discover something extraordinary about what it means to be American in the 21st century.
The Methodological Journey: Wrestling with “Average”
What does it mean to be average? This seemingly simple question reveals layers of complexity that illuminate the deeper challenge of defining American identity.
The Evolution of Our Approach
Our investigation employs multiple lenses to capture different dimensions of “averageness”:
- Mahalanobis Distance: Accounts for correlations between variables—a county might be average on education and income individually, but their combination might be unusual
- Euclidean Distance: Simple geometric distance from national means
- Median Absolute Deviation: Robust to outliers, focuses on typical deviations
- Quartile Spread: Measures consistency across the distribution of differences
- Maximum Deviation: Identifies counties with no extreme outliers
Each metric tells a different story about what makes a place “typical,” revealing that averageness itself is multifaceted.
Executive Summary
Key Discoveries:
- Van Buren County, Michigan emerges as America’s most comprehensively average county across 40+ demographic dimensions
- Perfect averageness is rare: Only a handful of counties achieve comprehensive demographic balance
- Geographic clustering: The most average counties concentrate in the Midwest and parts of the South
- Temporal shifts: Places that were average in 2010 are not necessarily average today—the definition of “typical America” is evolving
- The averageness paradox: Being thoroughly ordinary requires an extraordinary balancing act across dozens of variables
The Discovery Process: How Different Definitions Change Everything
Multiple Metrics, Multiple Stories
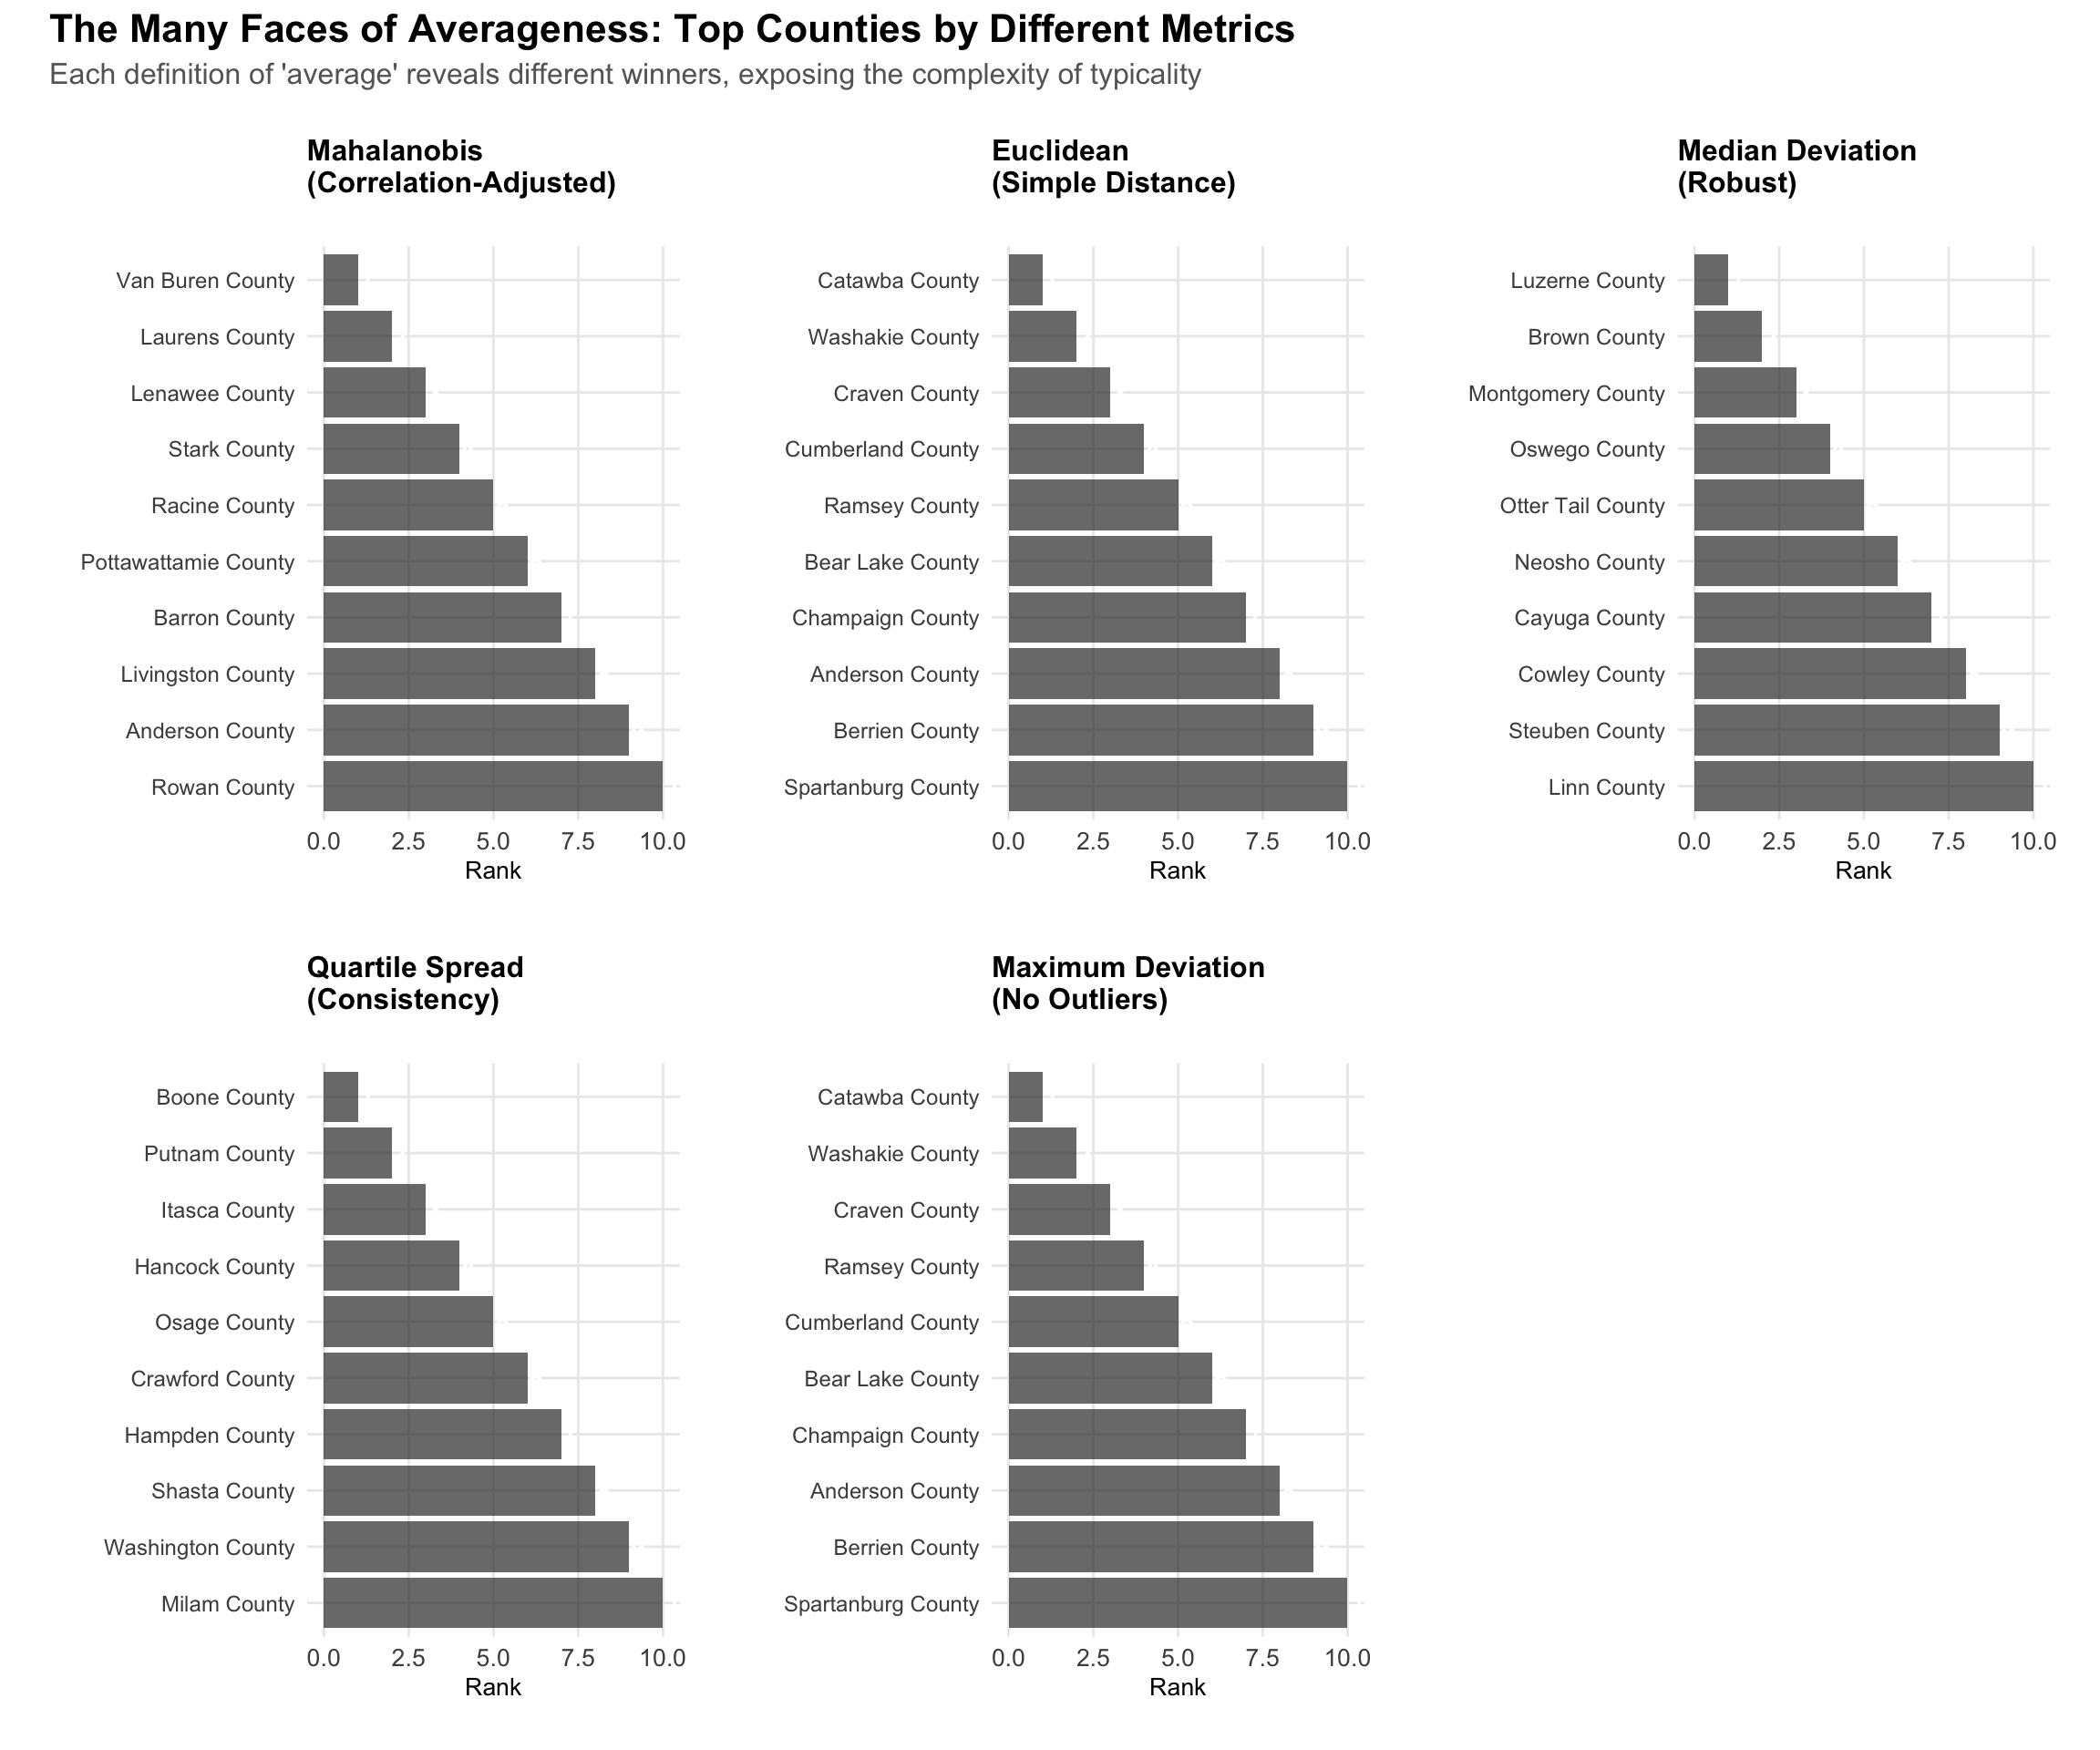
The Revelation: Different mathematical definitions of “average” produce dramatically different results. This isn’t a flaw—it’s a feature that reveals the multidimensional nature of demographic typicality.
- Mahalanobis distance rewards counties that balance correlated variables appropriately
- Euclidean distance treats all variables as equally important
- Median deviation focuses on consistency across the middle of distributions
- Quartile spread identifies counties with narrow ranges of deviations
- Maximum deviation finds places with no extreme outliers
The Consistency Test: Counties That Appear Average by Any Measure
| The Consistently Average: Counties Appearing in Multiple Top-10 Lists | ||
| These places achieve averageness by any mathematical definition | ||
| County | Times in Top 10 | % of Metrics |
|---|---|---|
| Anderson County, Tennessee | 2 | 40.00% |
| Bear Lake County, Idaho | 2 | 40.00% |
| Berrien County, Michigan | 2 | 40.00% |
| Catawba County, North Carolina | 2 | 40.00% |
| Champaign County, Illinois | 2 | 40.00% |
| Craven County, North Carolina | 2 | 40.00% |
| Cumberland County, New Jersey | 2 | 40.00% |
| Ramsey County, North Dakota | 2 | 40.00% |
| Spartanburg County, South Carolina | 2 | 40.00% |
| Washakie County, Wyoming | 2 | 40.00% |
| Source: Analysis of 5 different averageness metrics | ||
The True Champions of Ordinariness: Counties appearing in multiple top-10 lists represent places that achieve averageness by any reasonable definition—the statistical equivalent of being fluent in multiple languages of typicality.
The Geographic Soul of America
Mapping the Goldilocks Zone
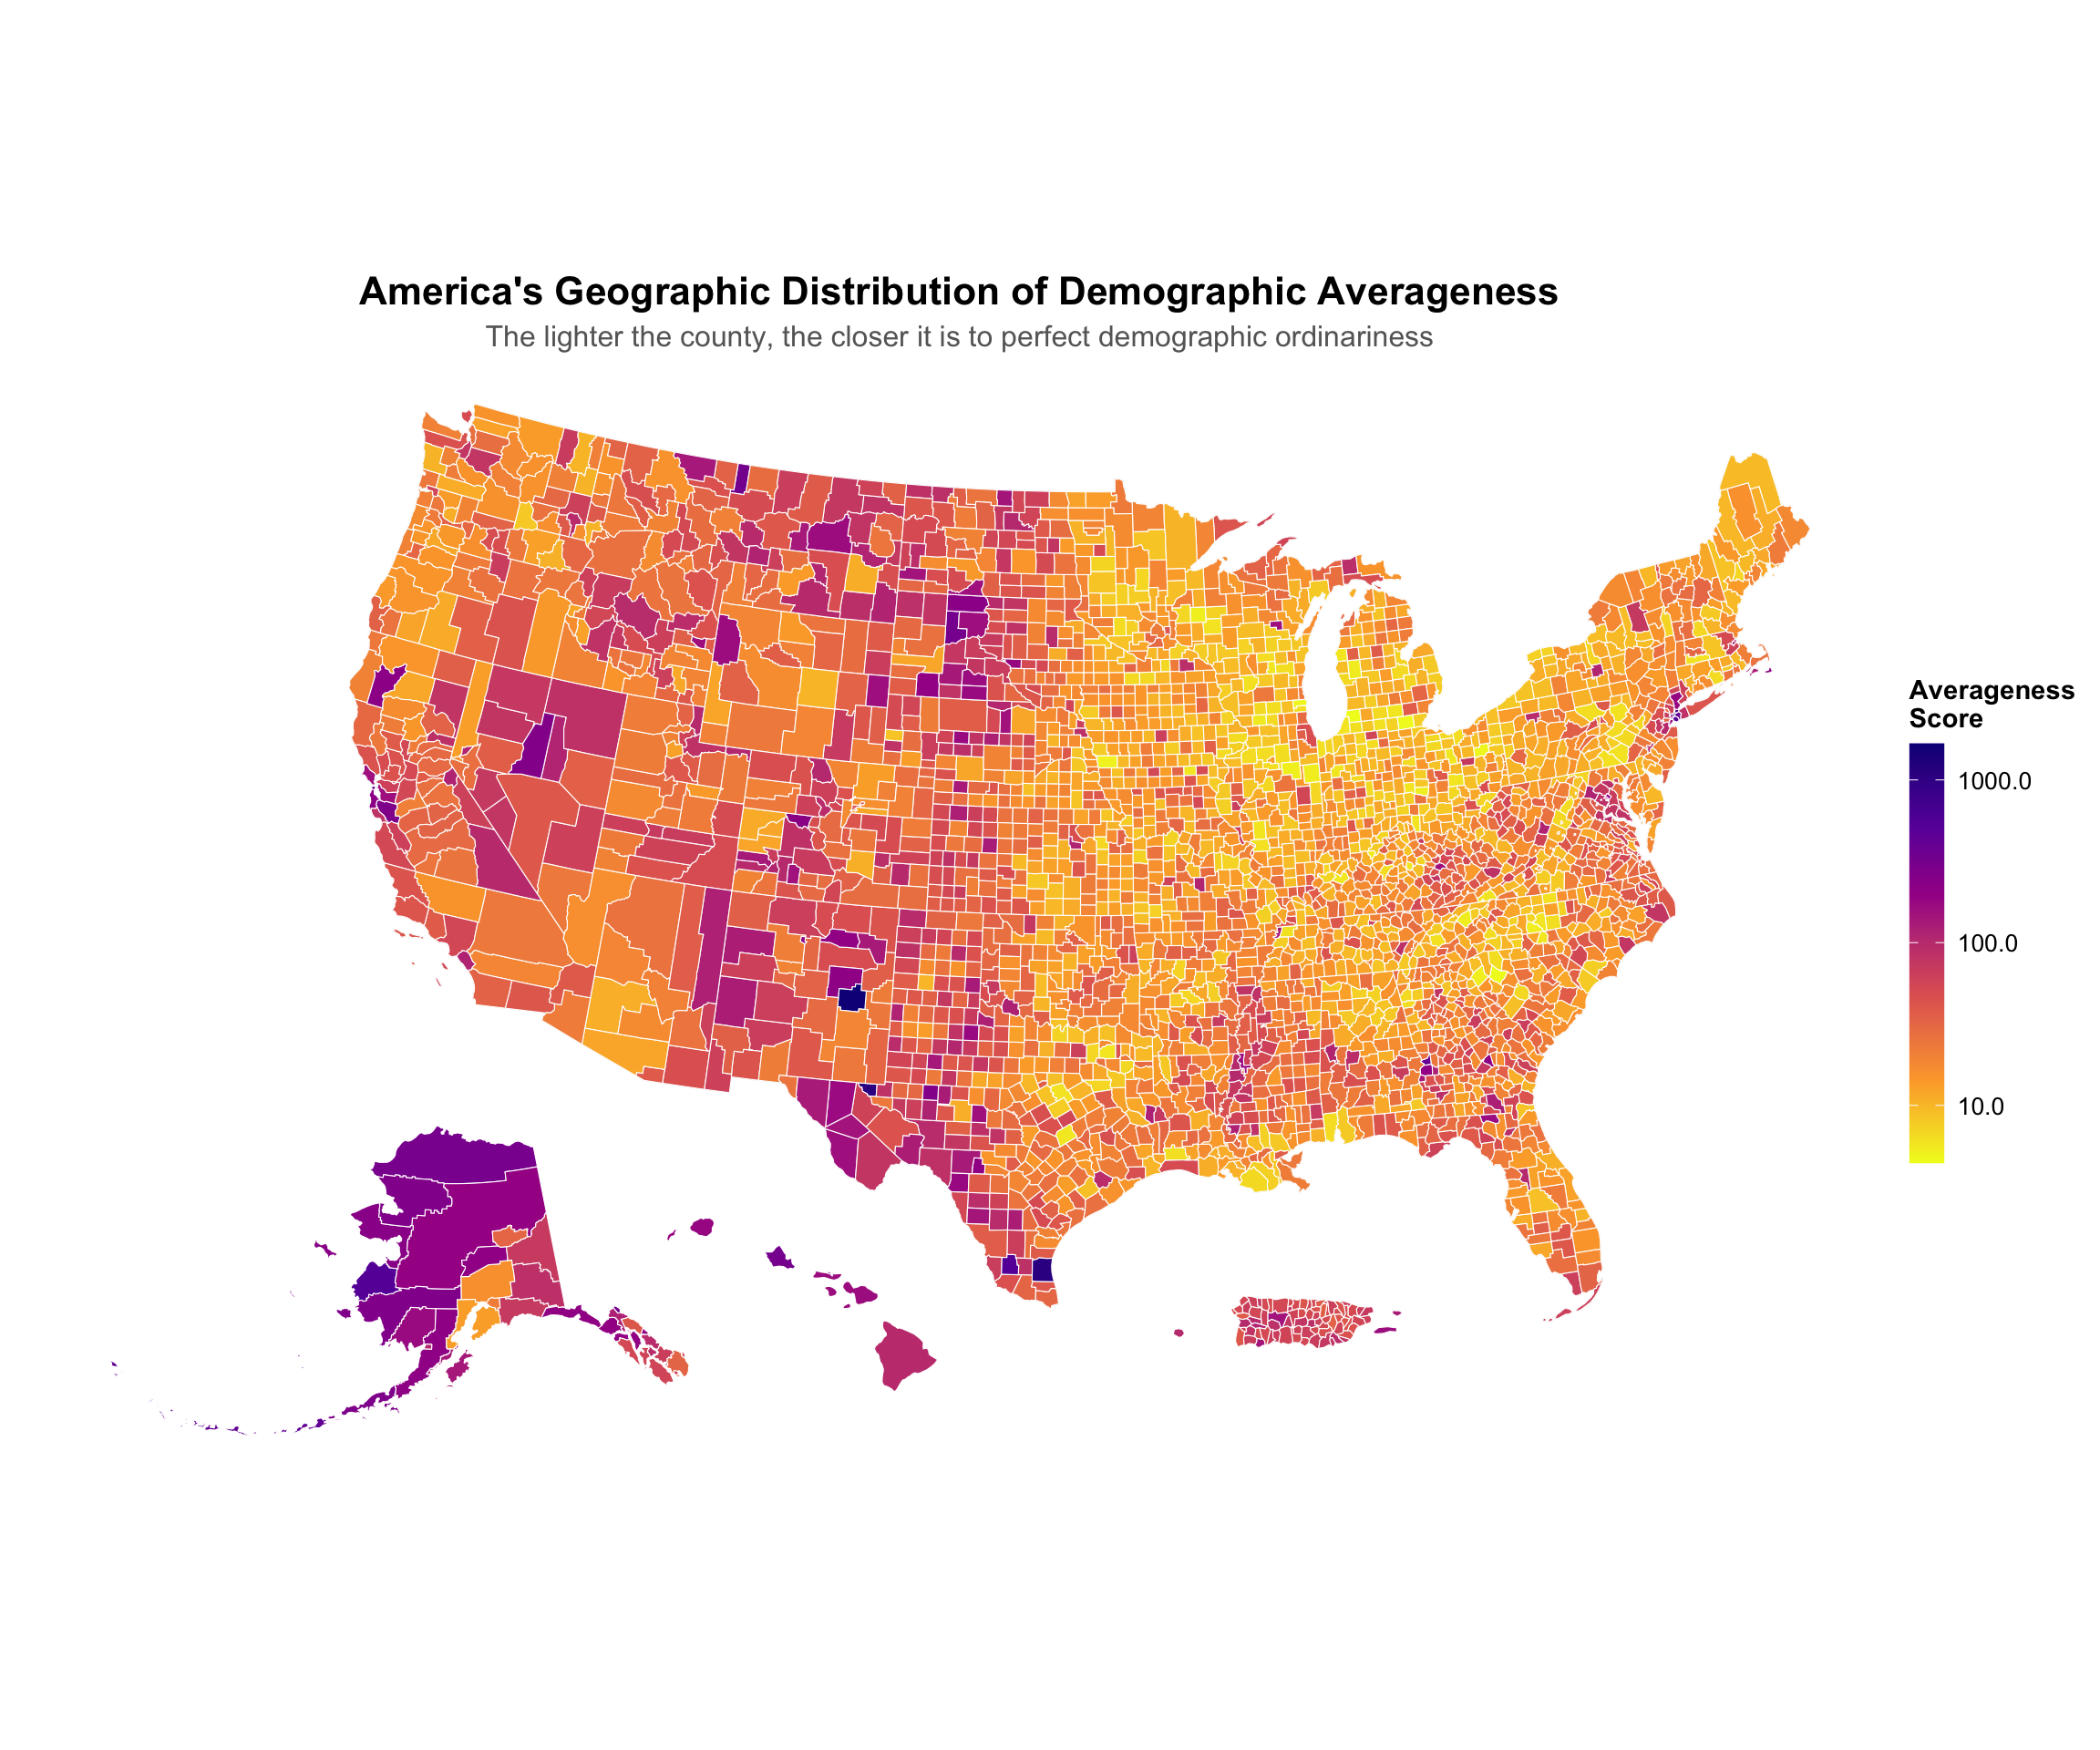
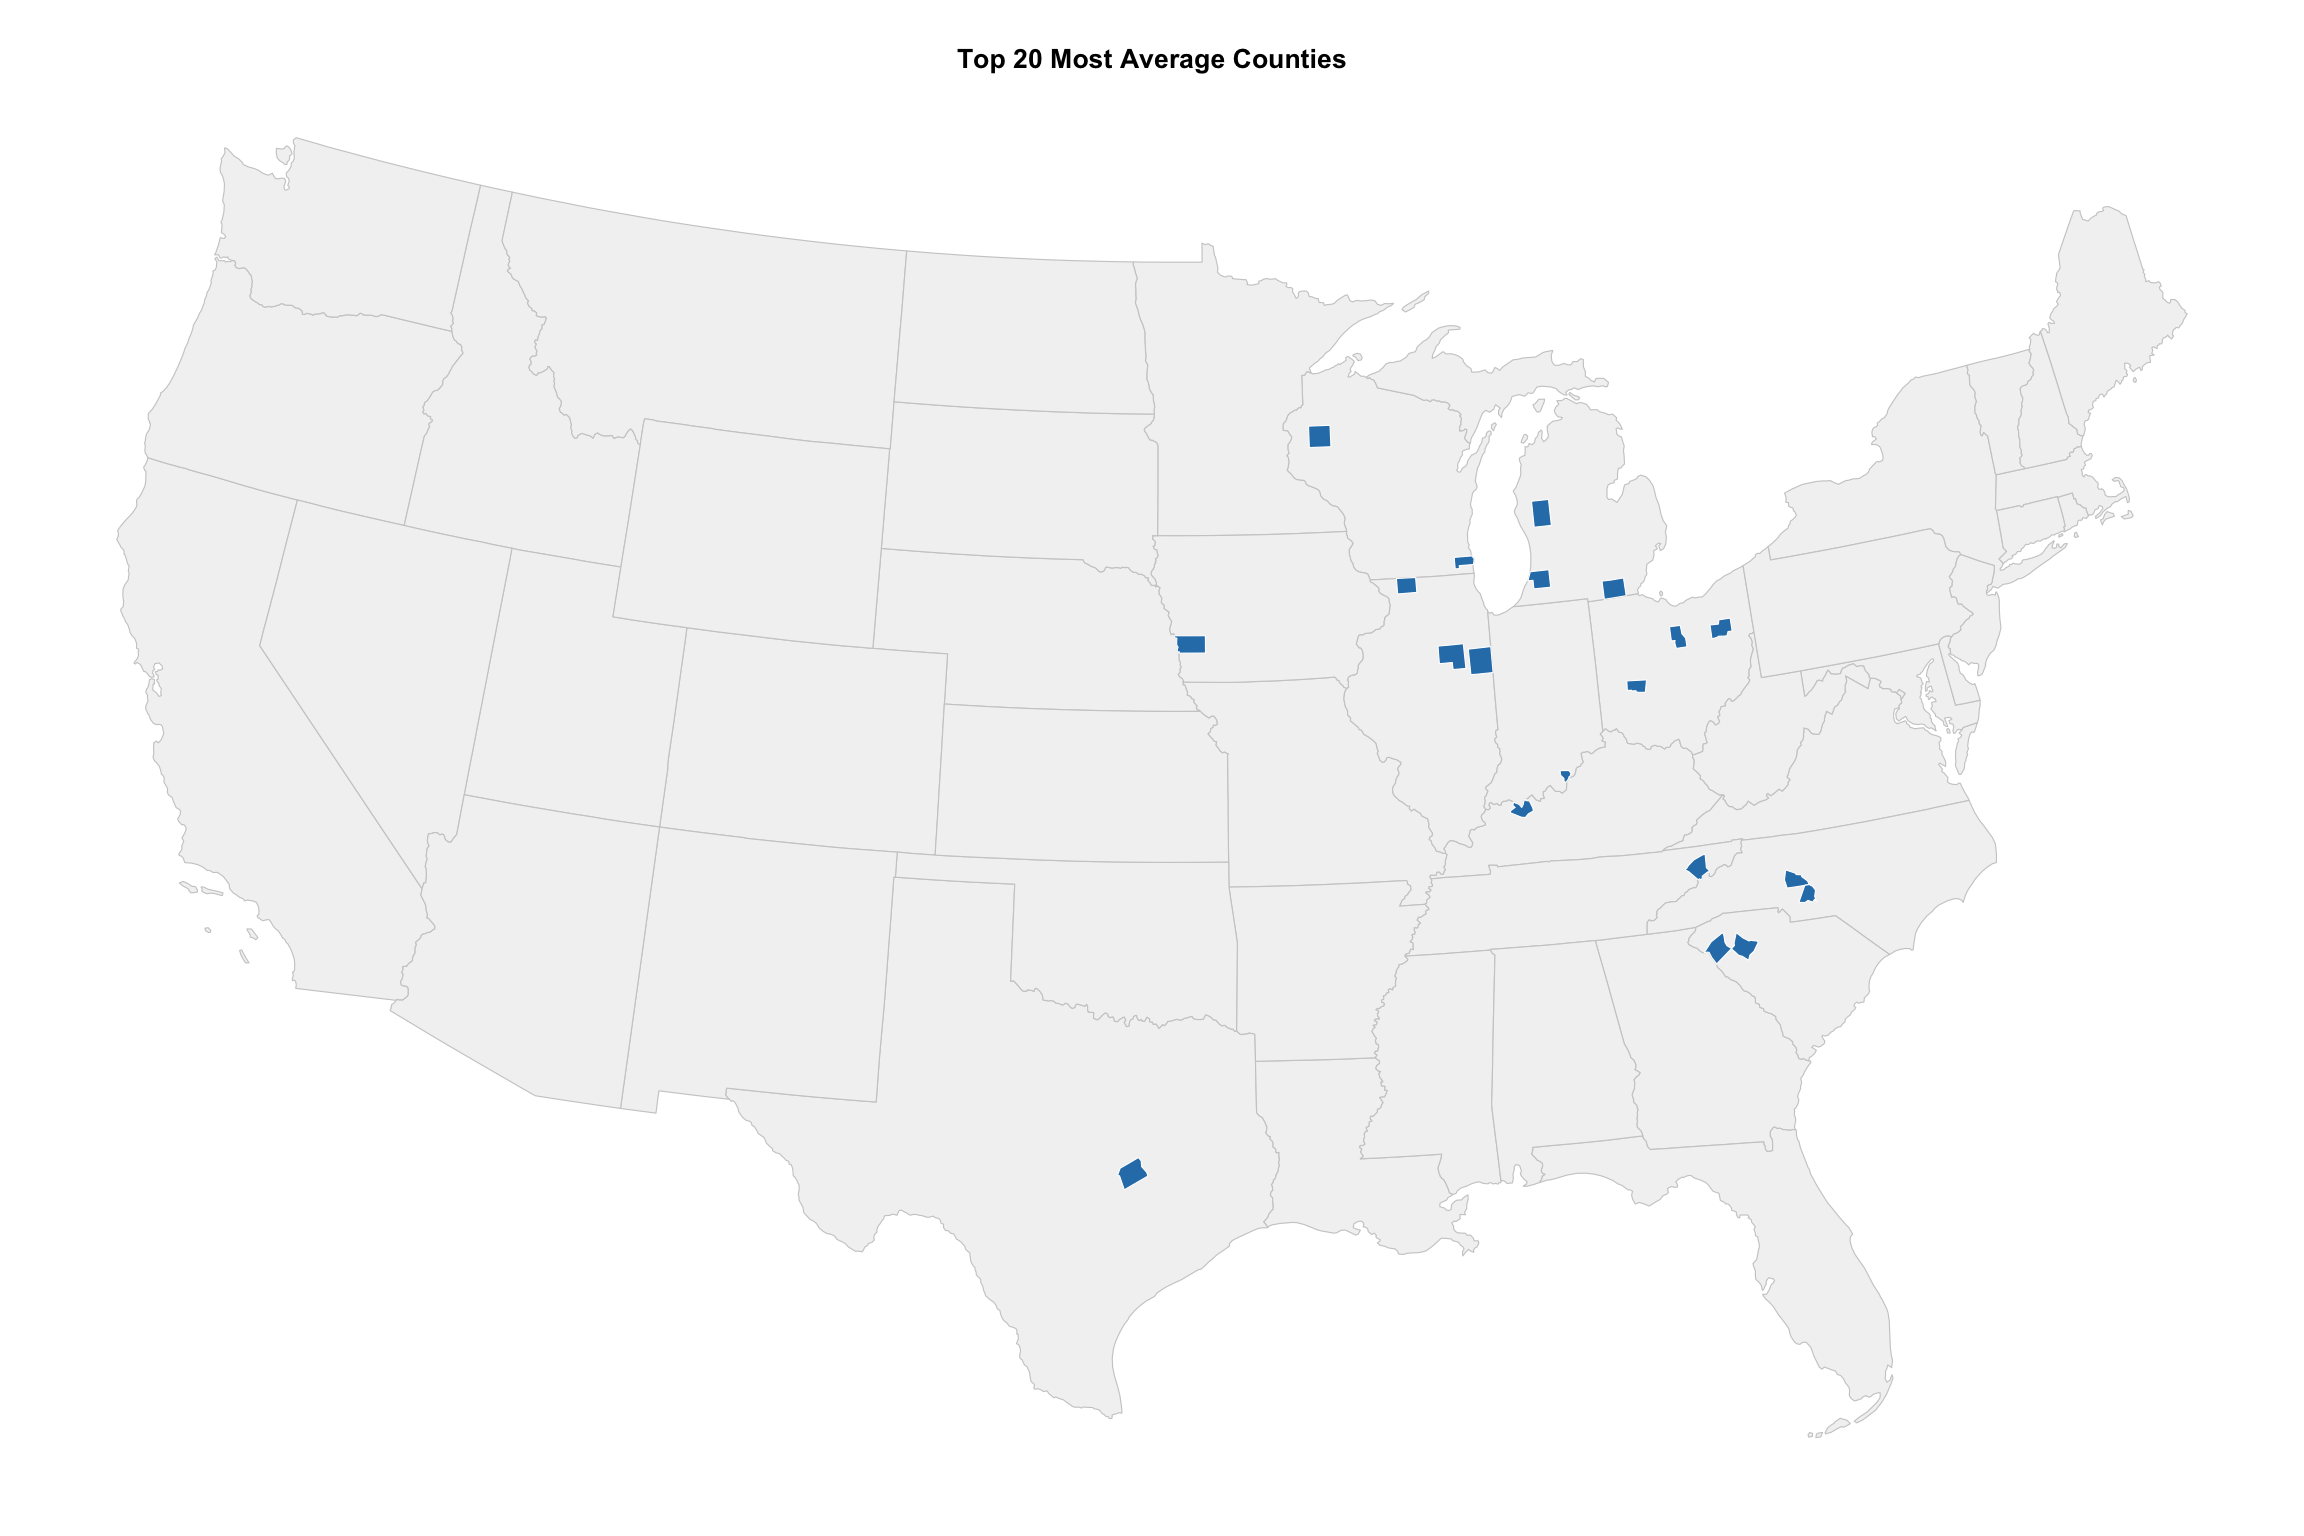
Geographic Patterns of Ordinariness:
- The Midwest Dominance: Michigan, Ohio, Wisconsin, and Iowa emerge as the heartland of American averageness
- Southern Balance: The Carolinas and parts of the South contribute significantly to the Goldilocks Zone
- Coastal Extremes: East and West Coast counties tend toward demographic distinctiveness
- Western Variability: Mountain West shows high variance, with few comprehensively average places
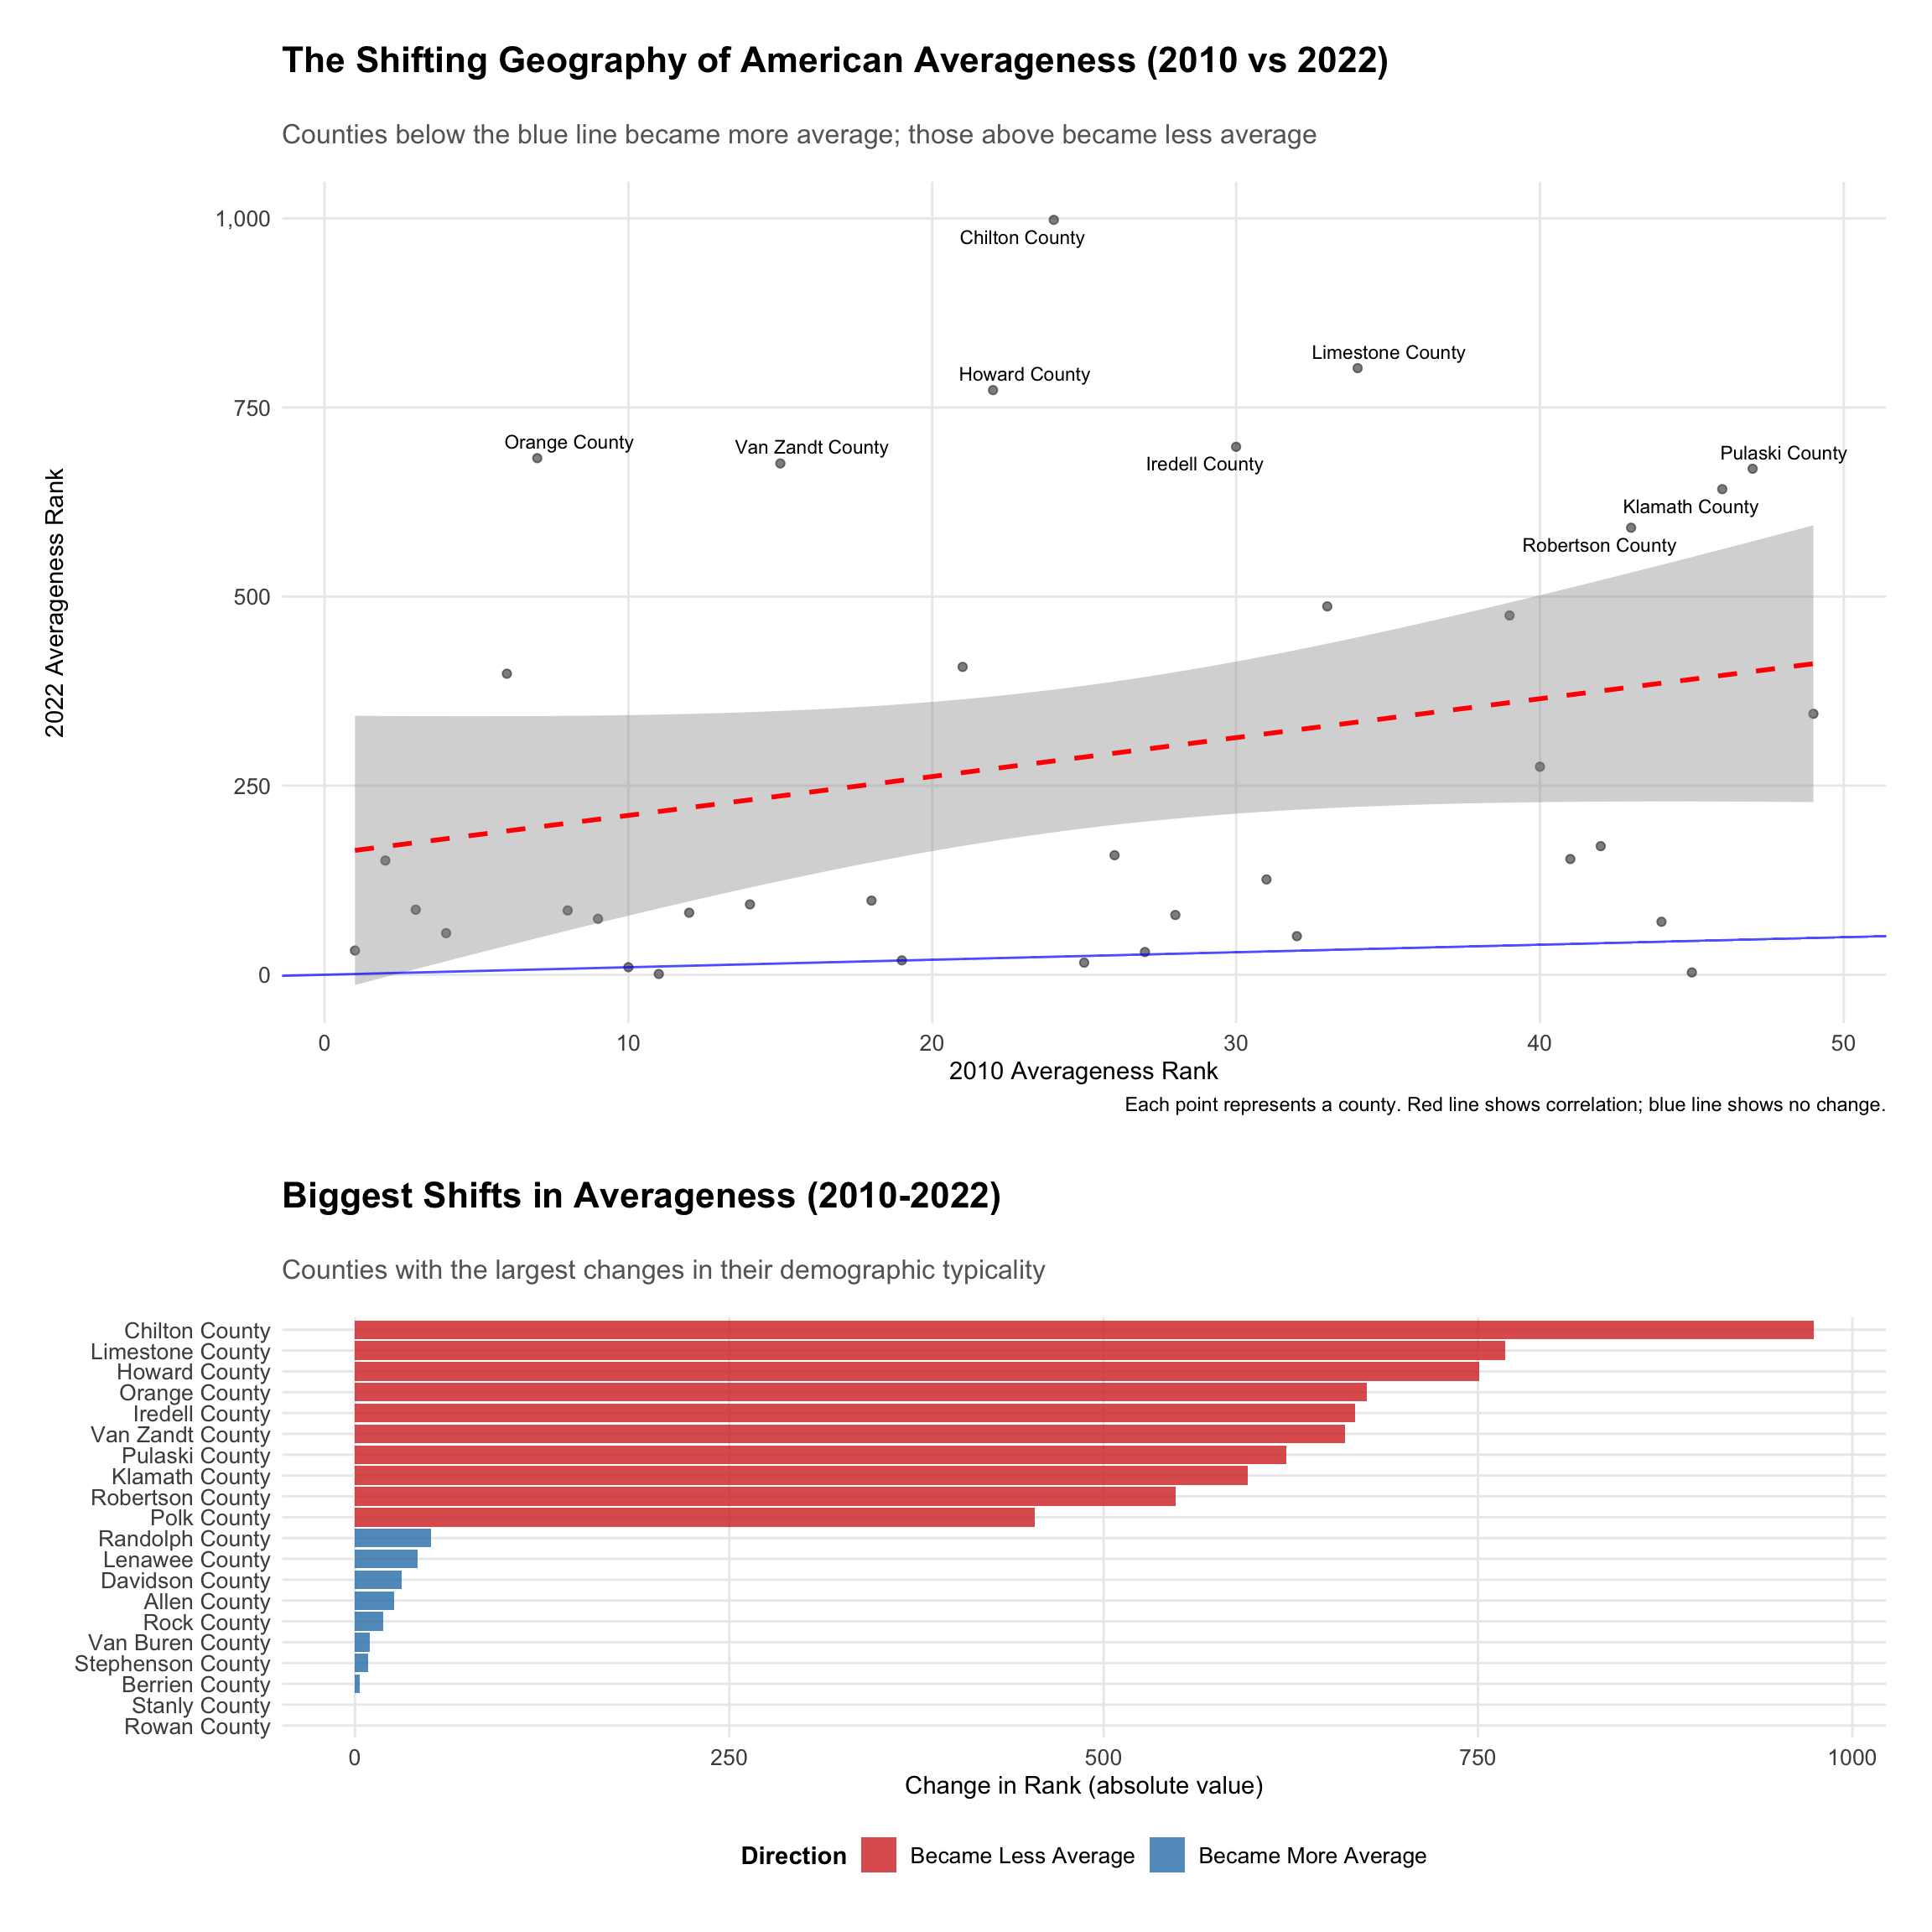
The Evolution of Averageness: 2010 vs 2022
How America’s Center Has Shifted
##
## ## Geographic Shifts: 2010 vs 2022 Choropleth Comparison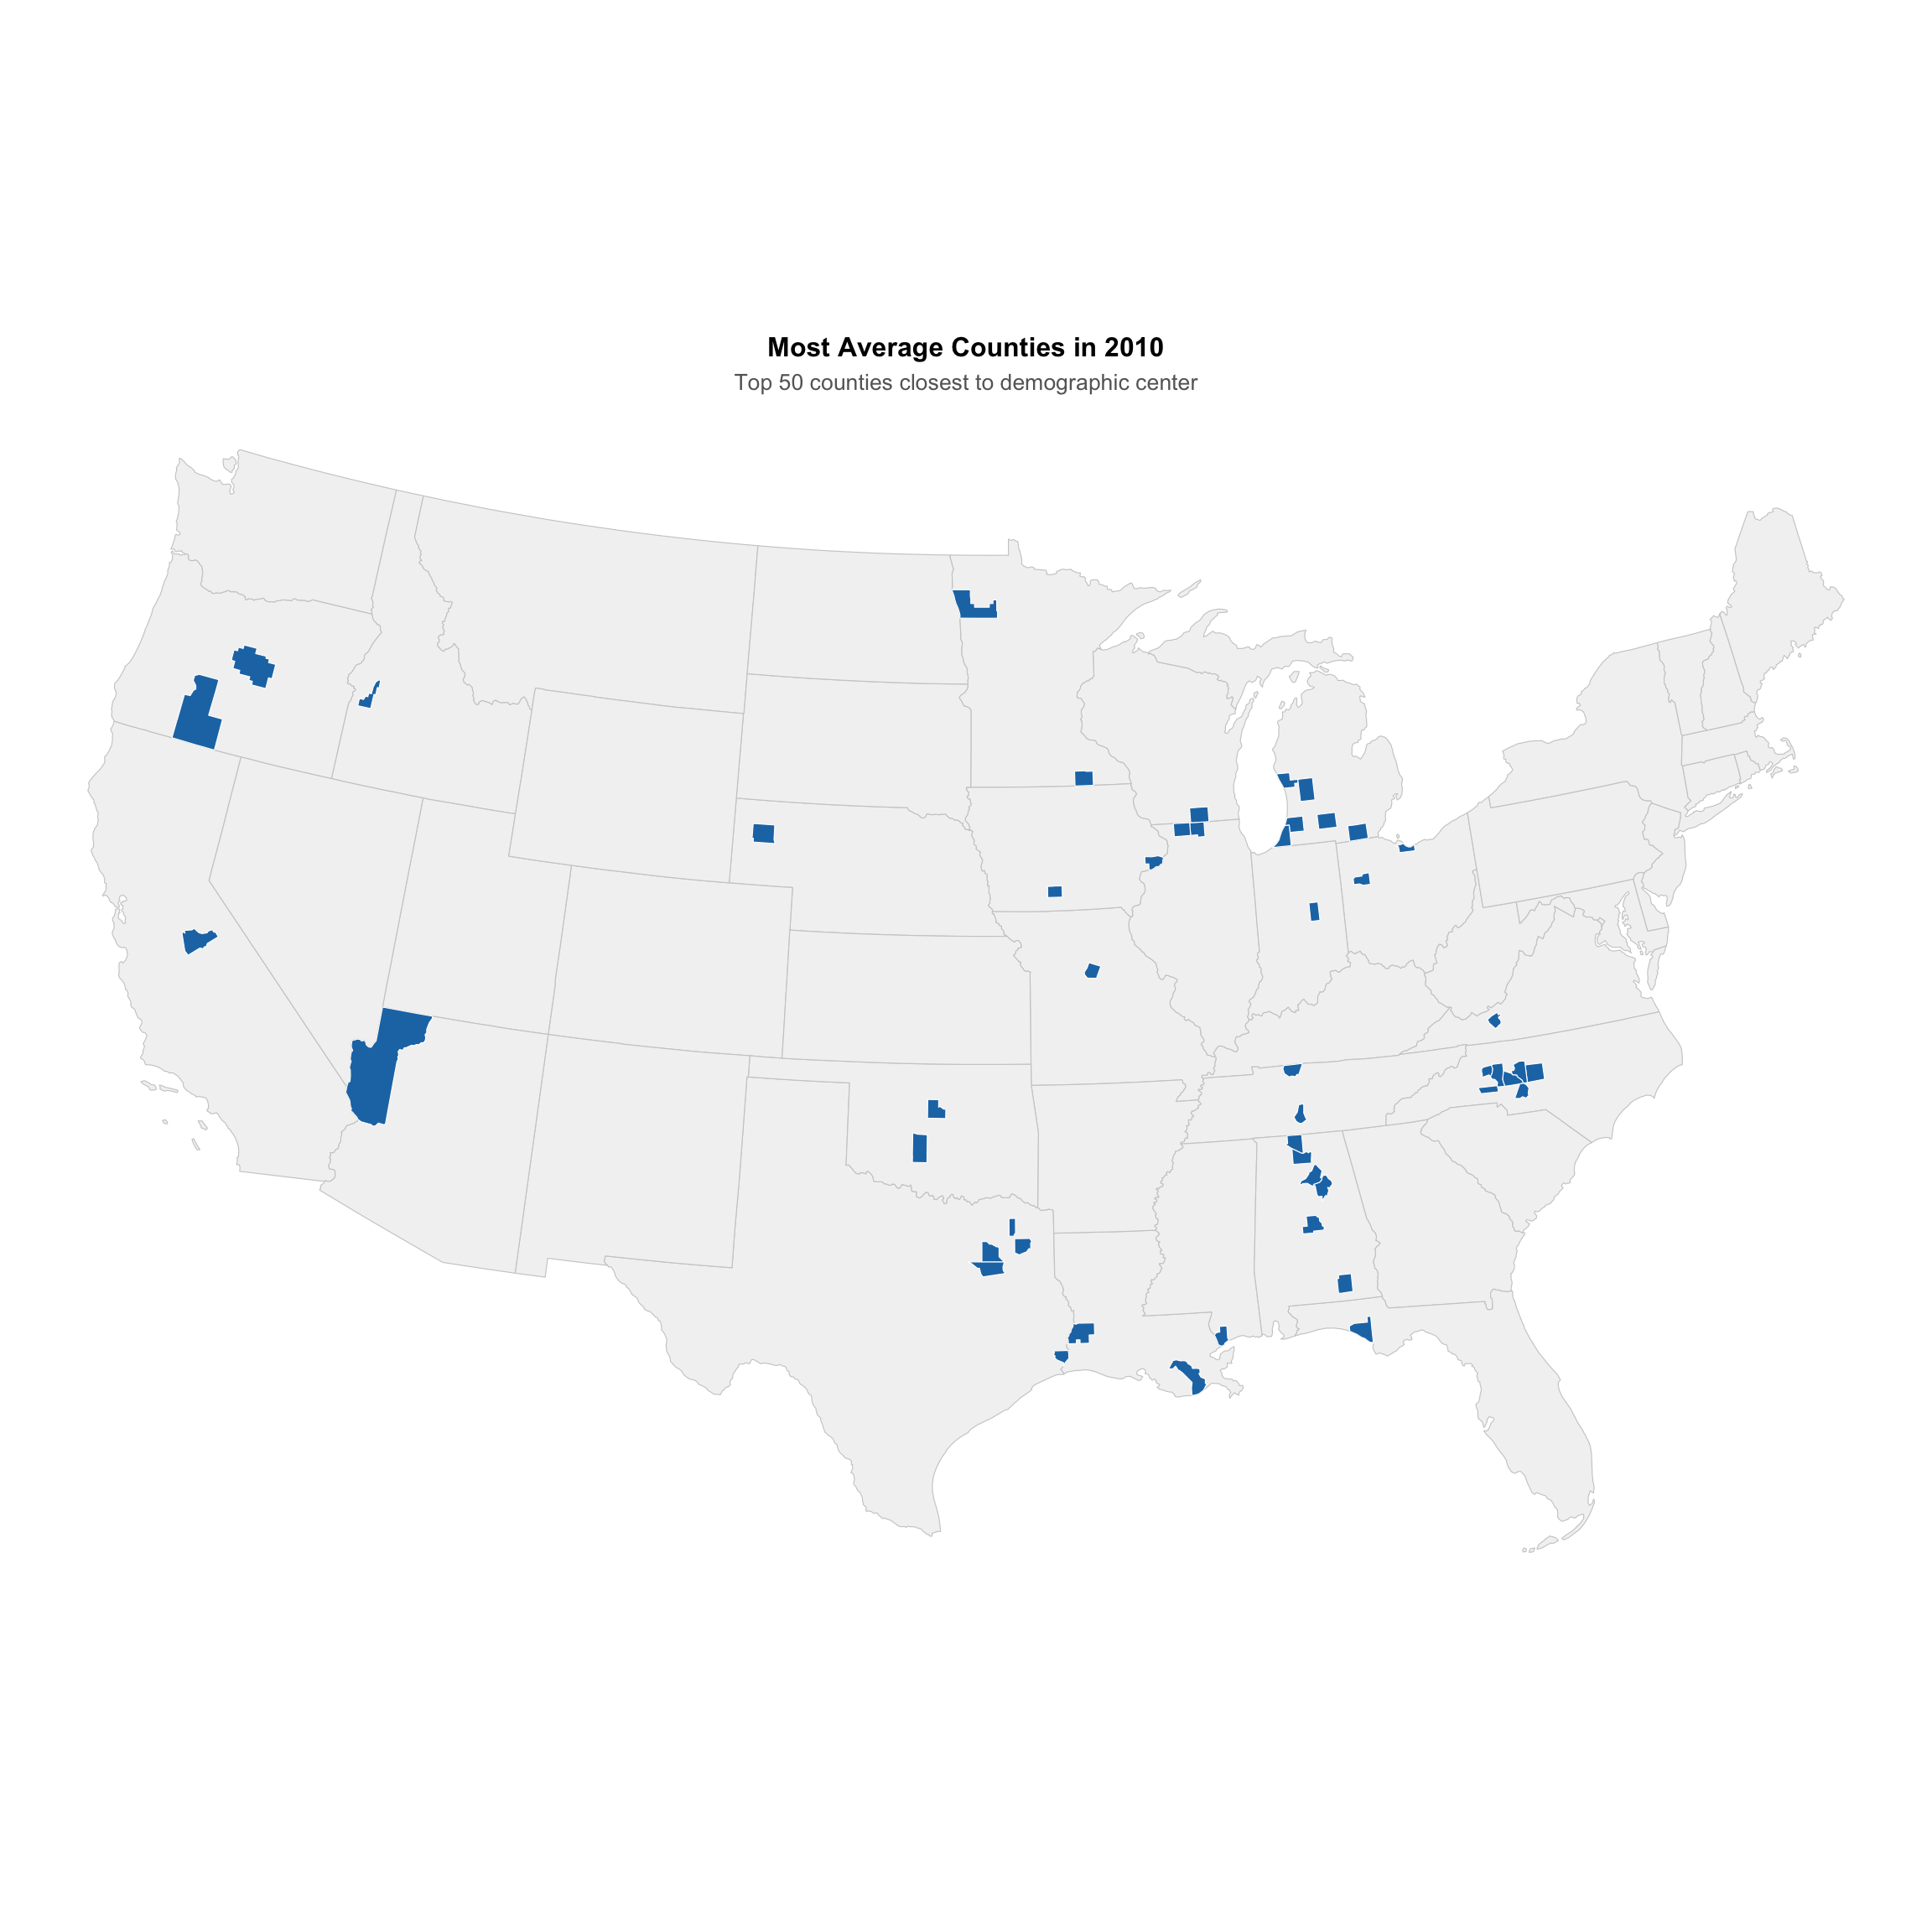
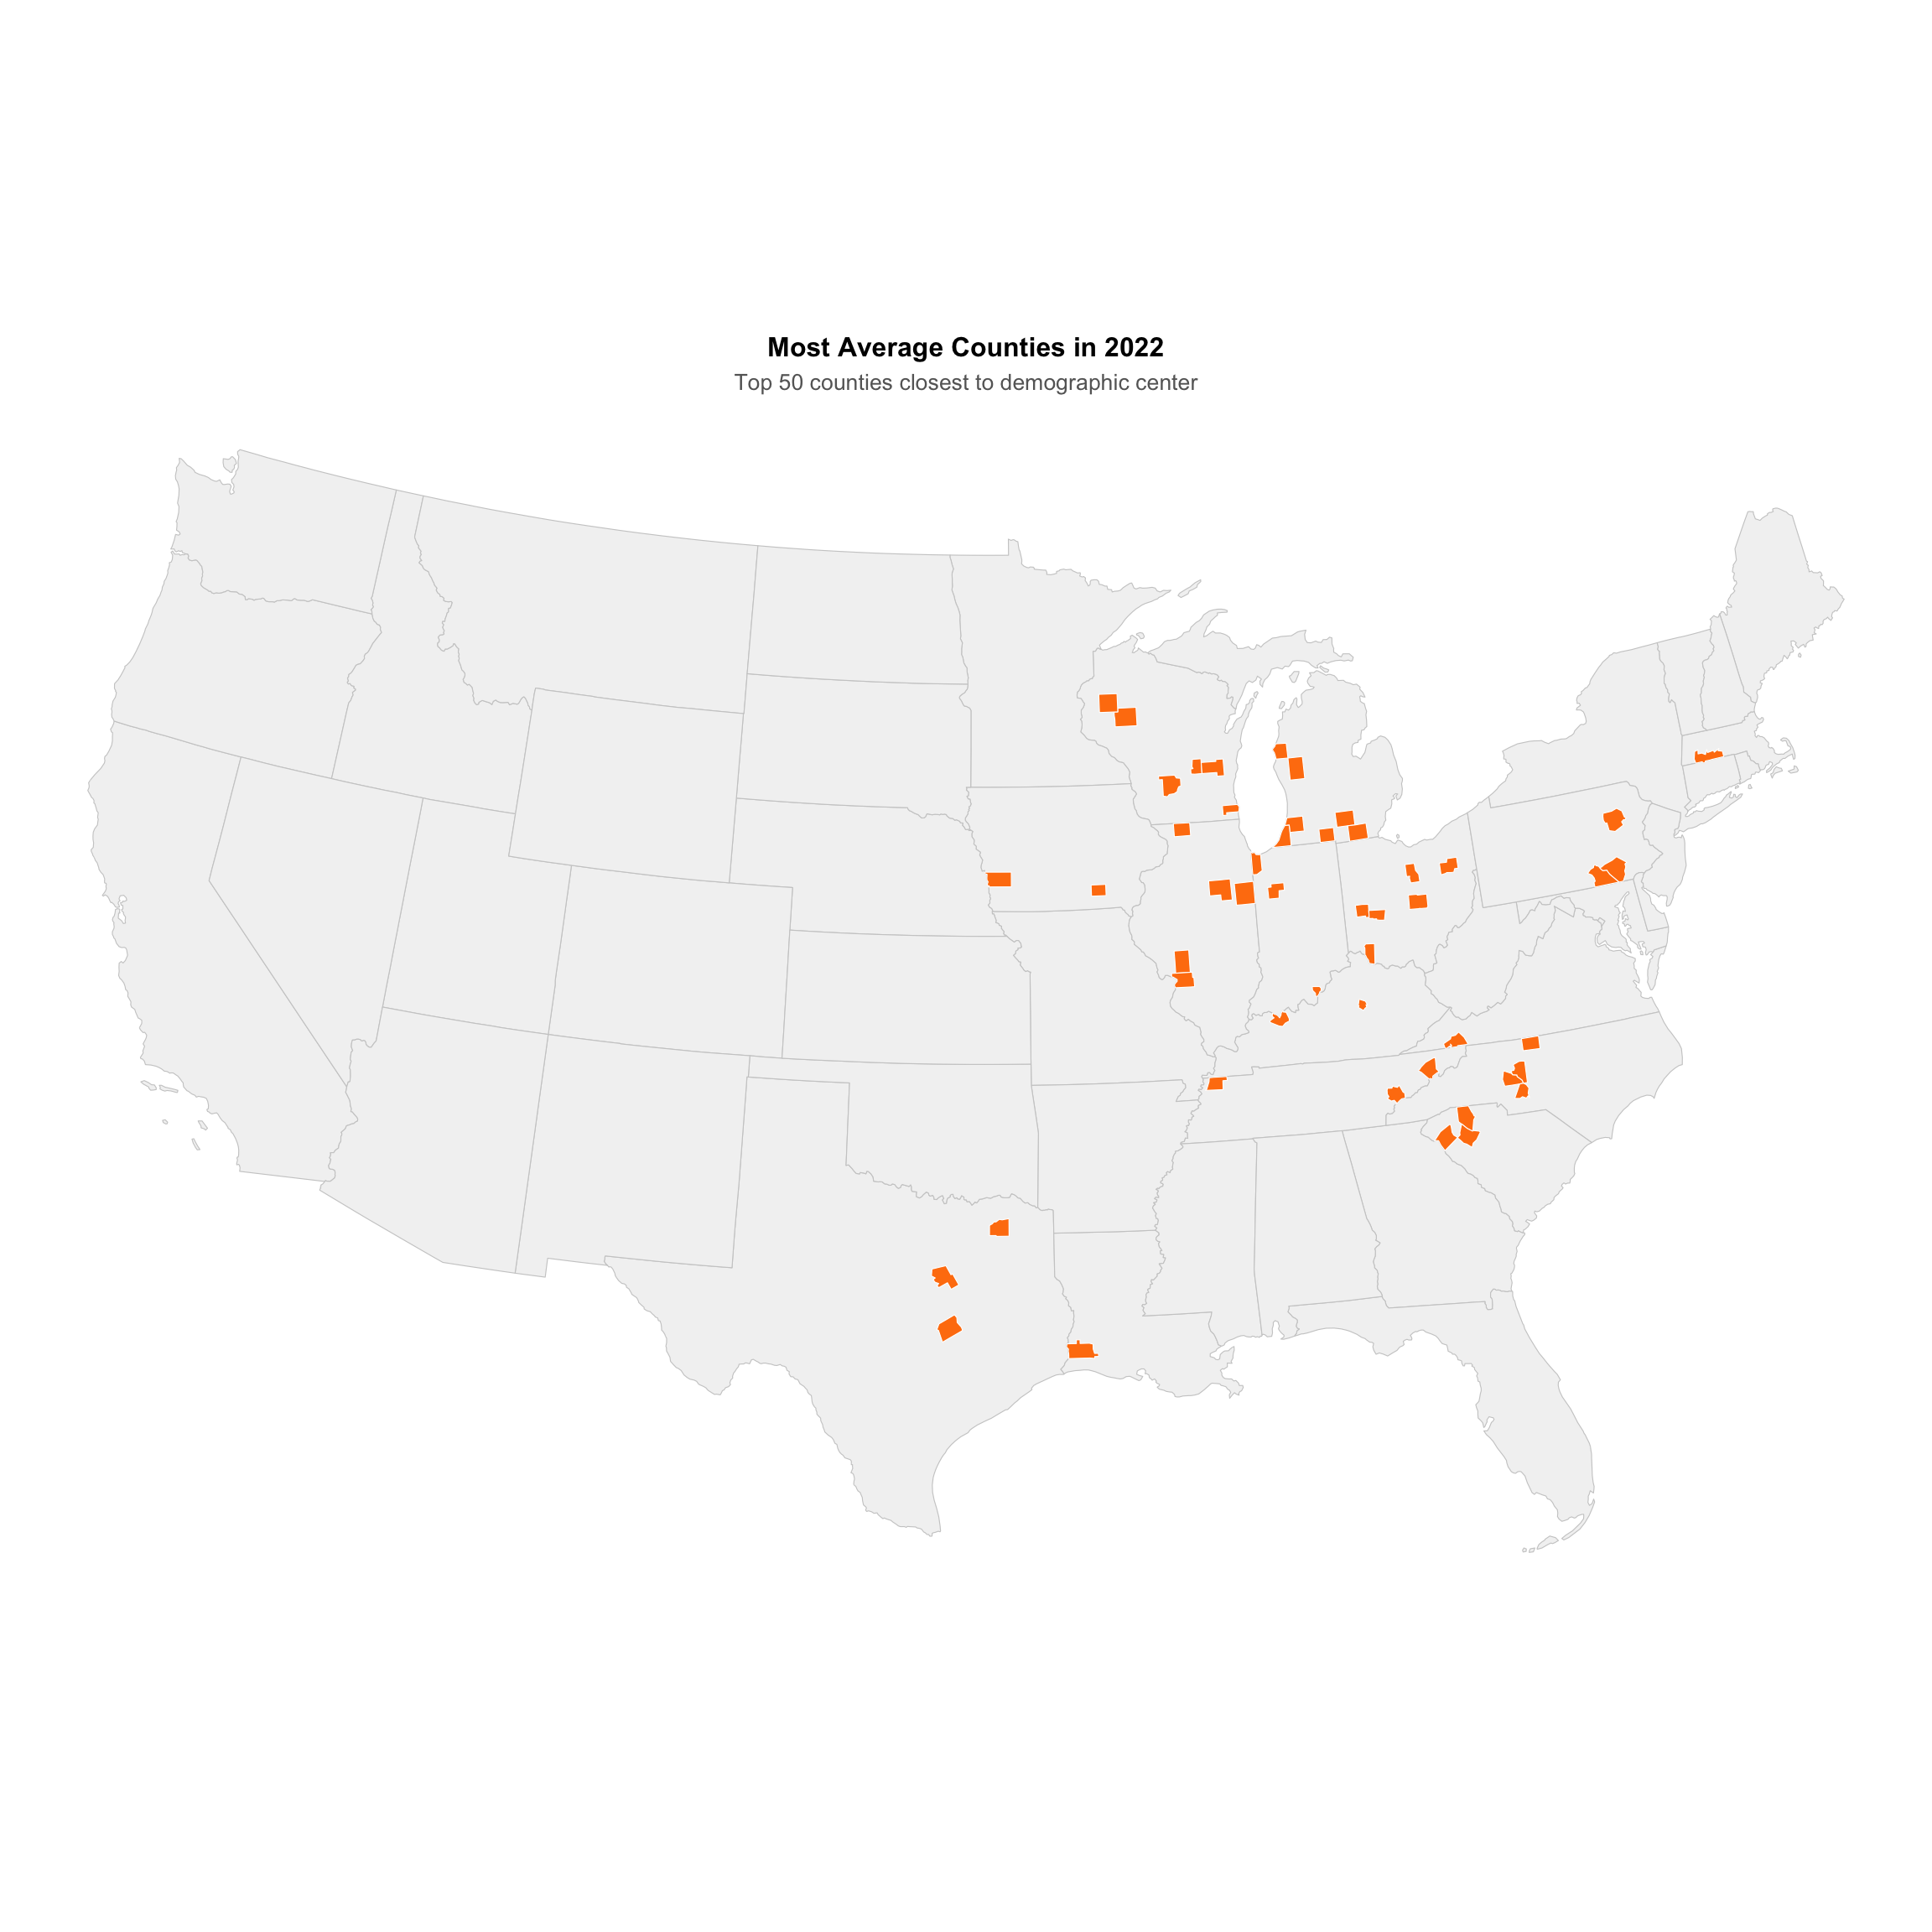
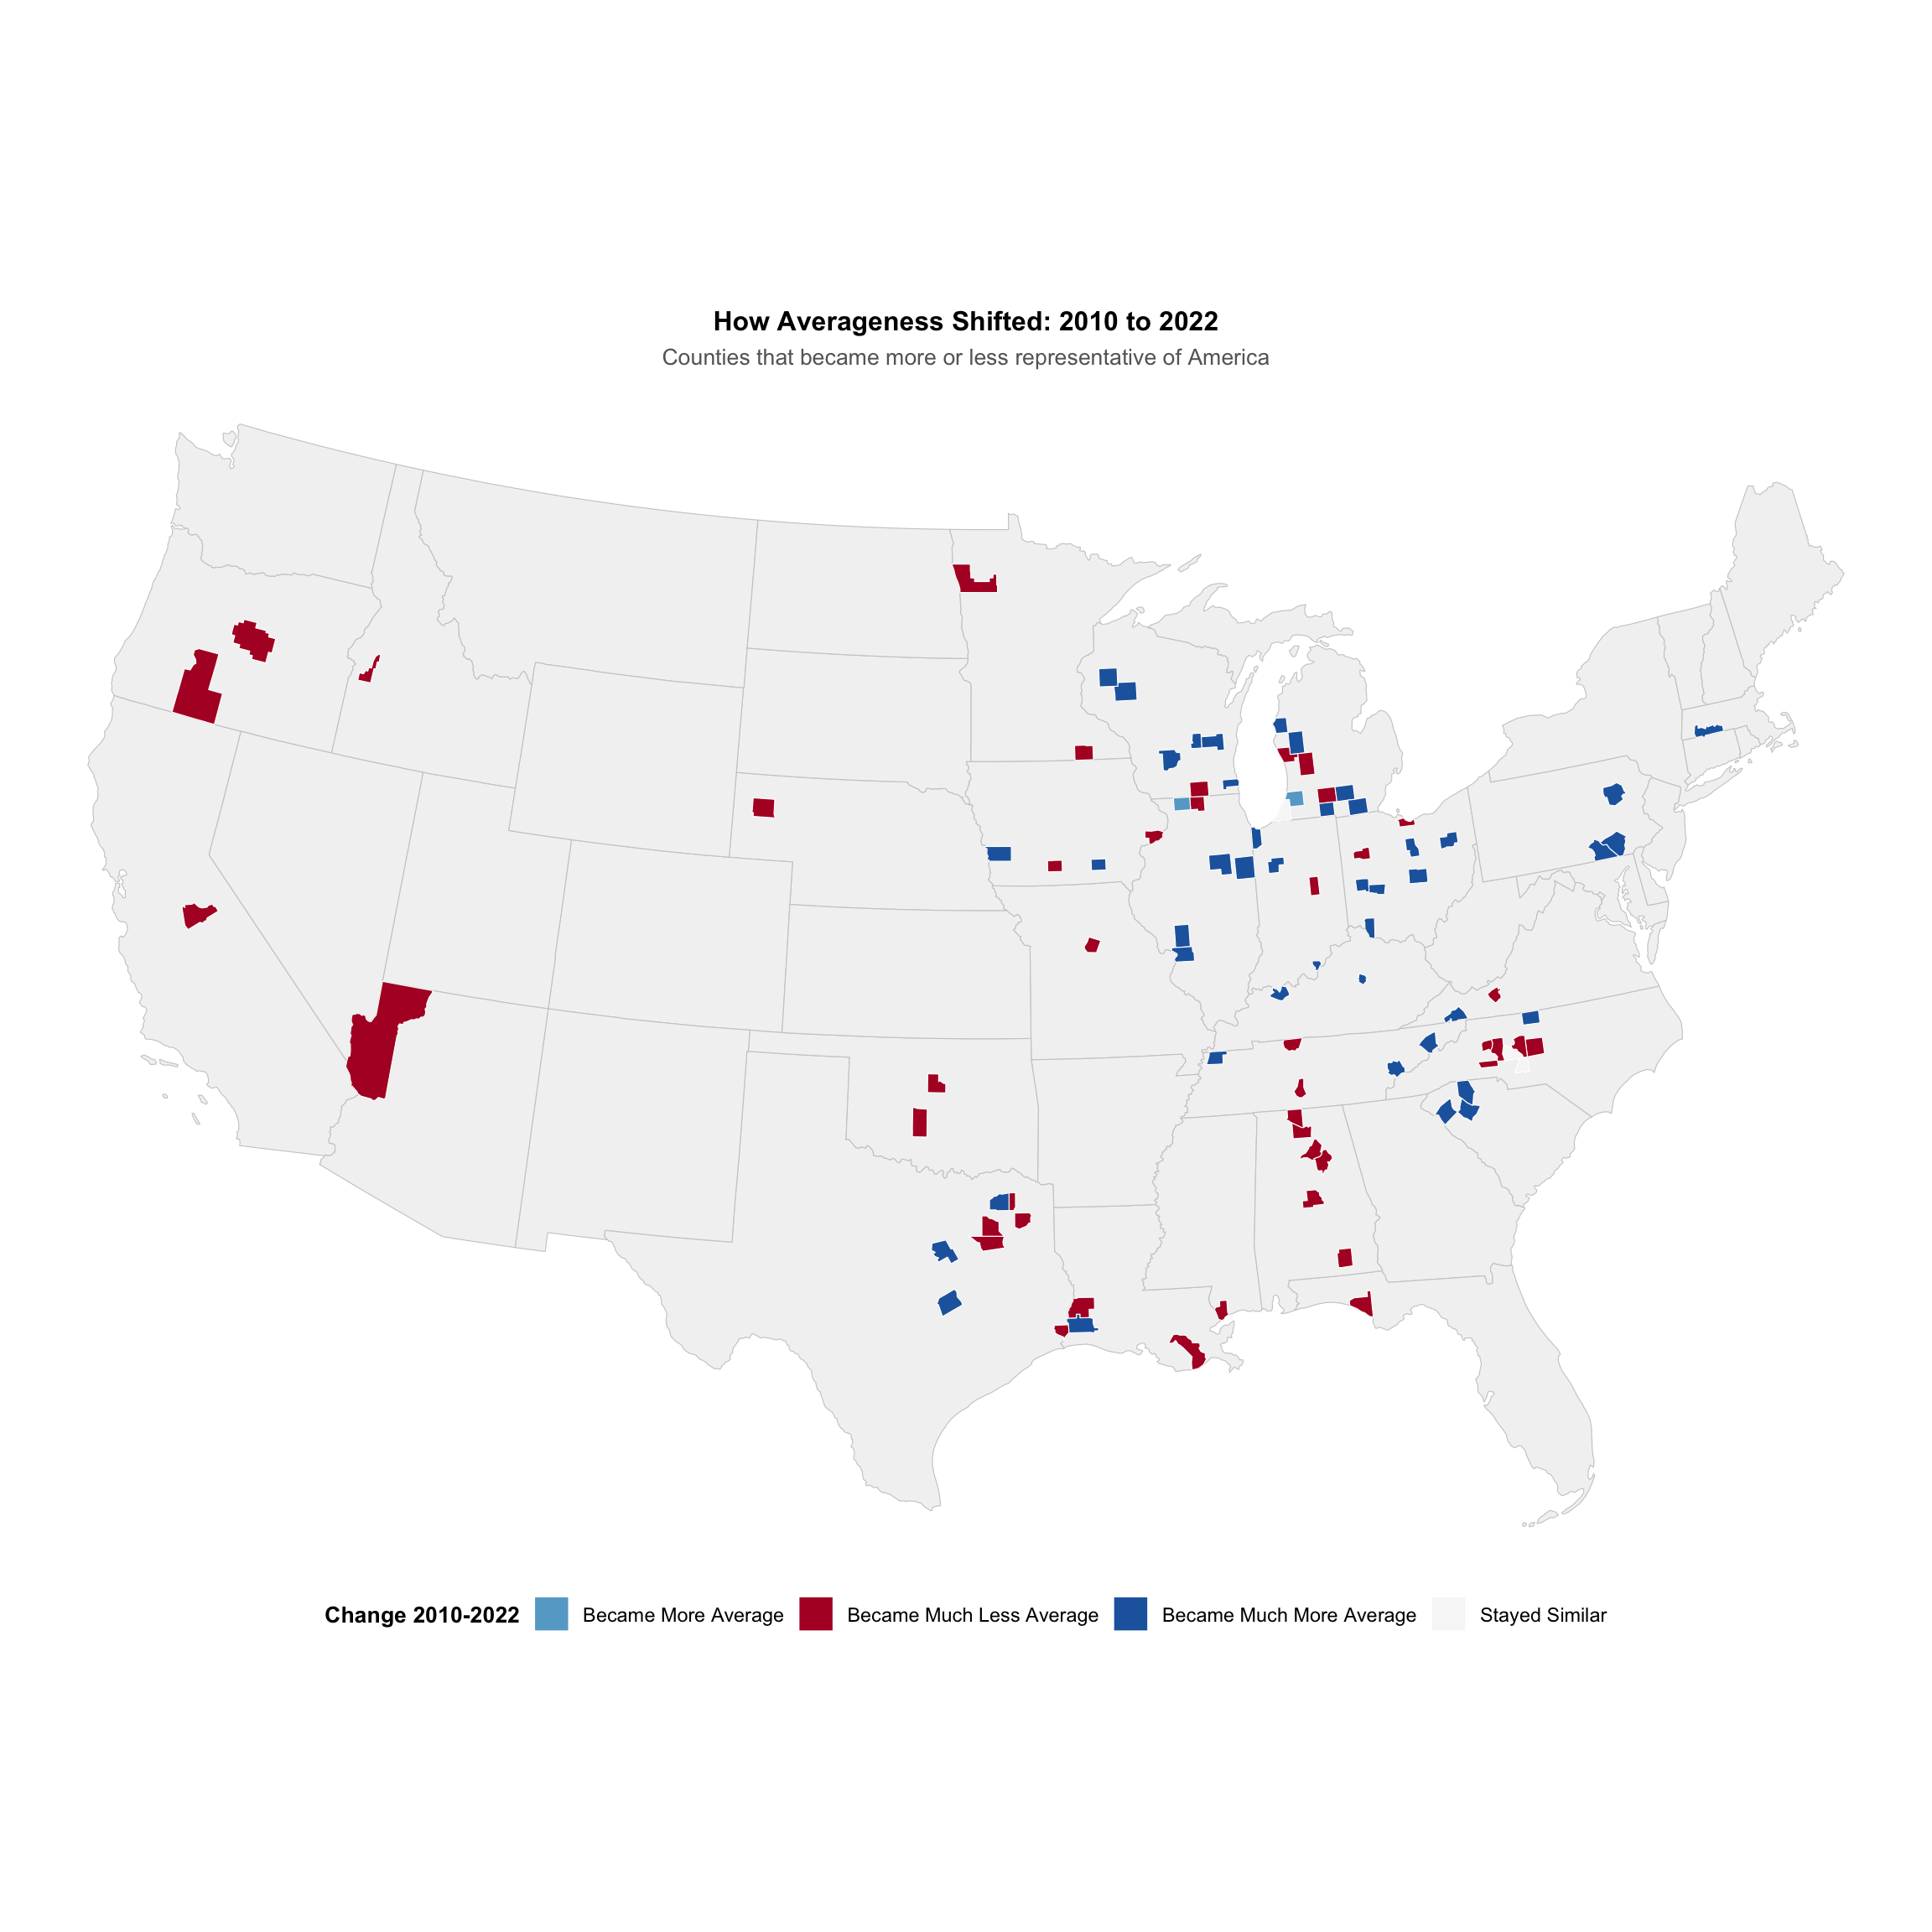
Key Temporal Insights:
- Demographic stability: The correlation between 2010 and 2022 rankings suggests some consistency in what makes places average
- Notable shifts: Some counties have dramatically moved toward or away from averageness as America’s demographic center has evolved
- Regional patterns: Changes often reflect broader demographic trends like urbanization, aging, and economic transformation
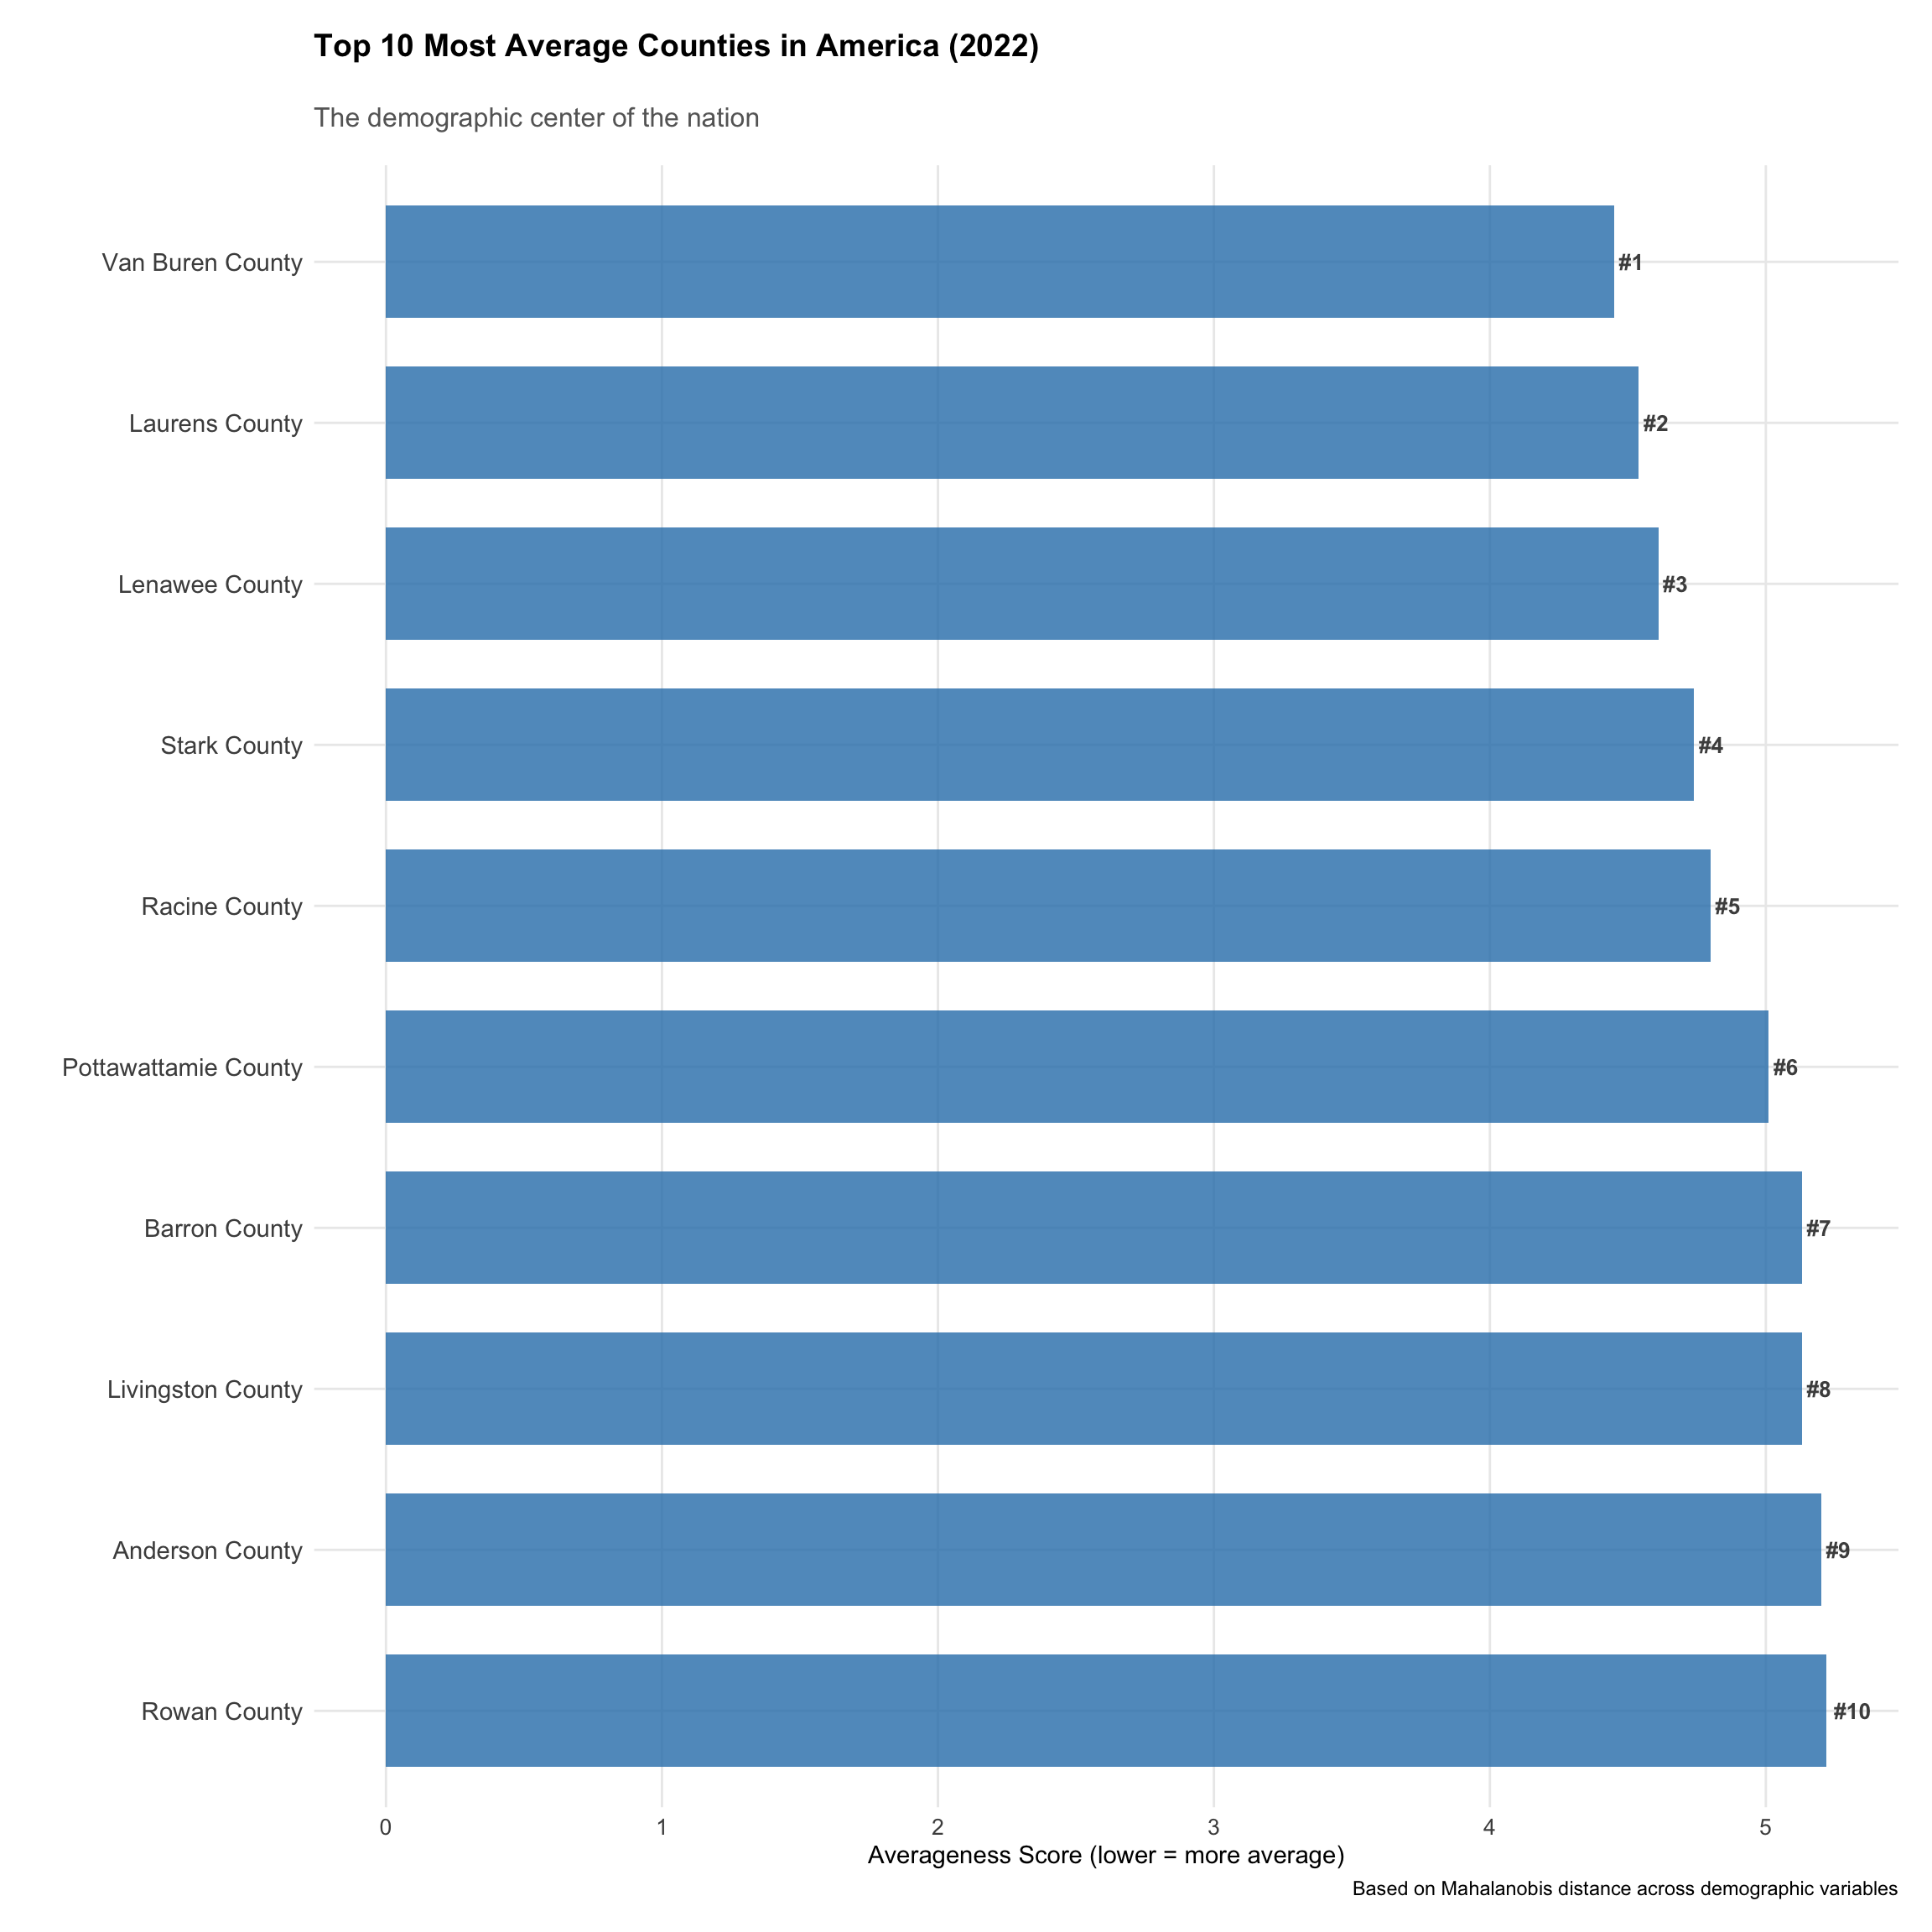
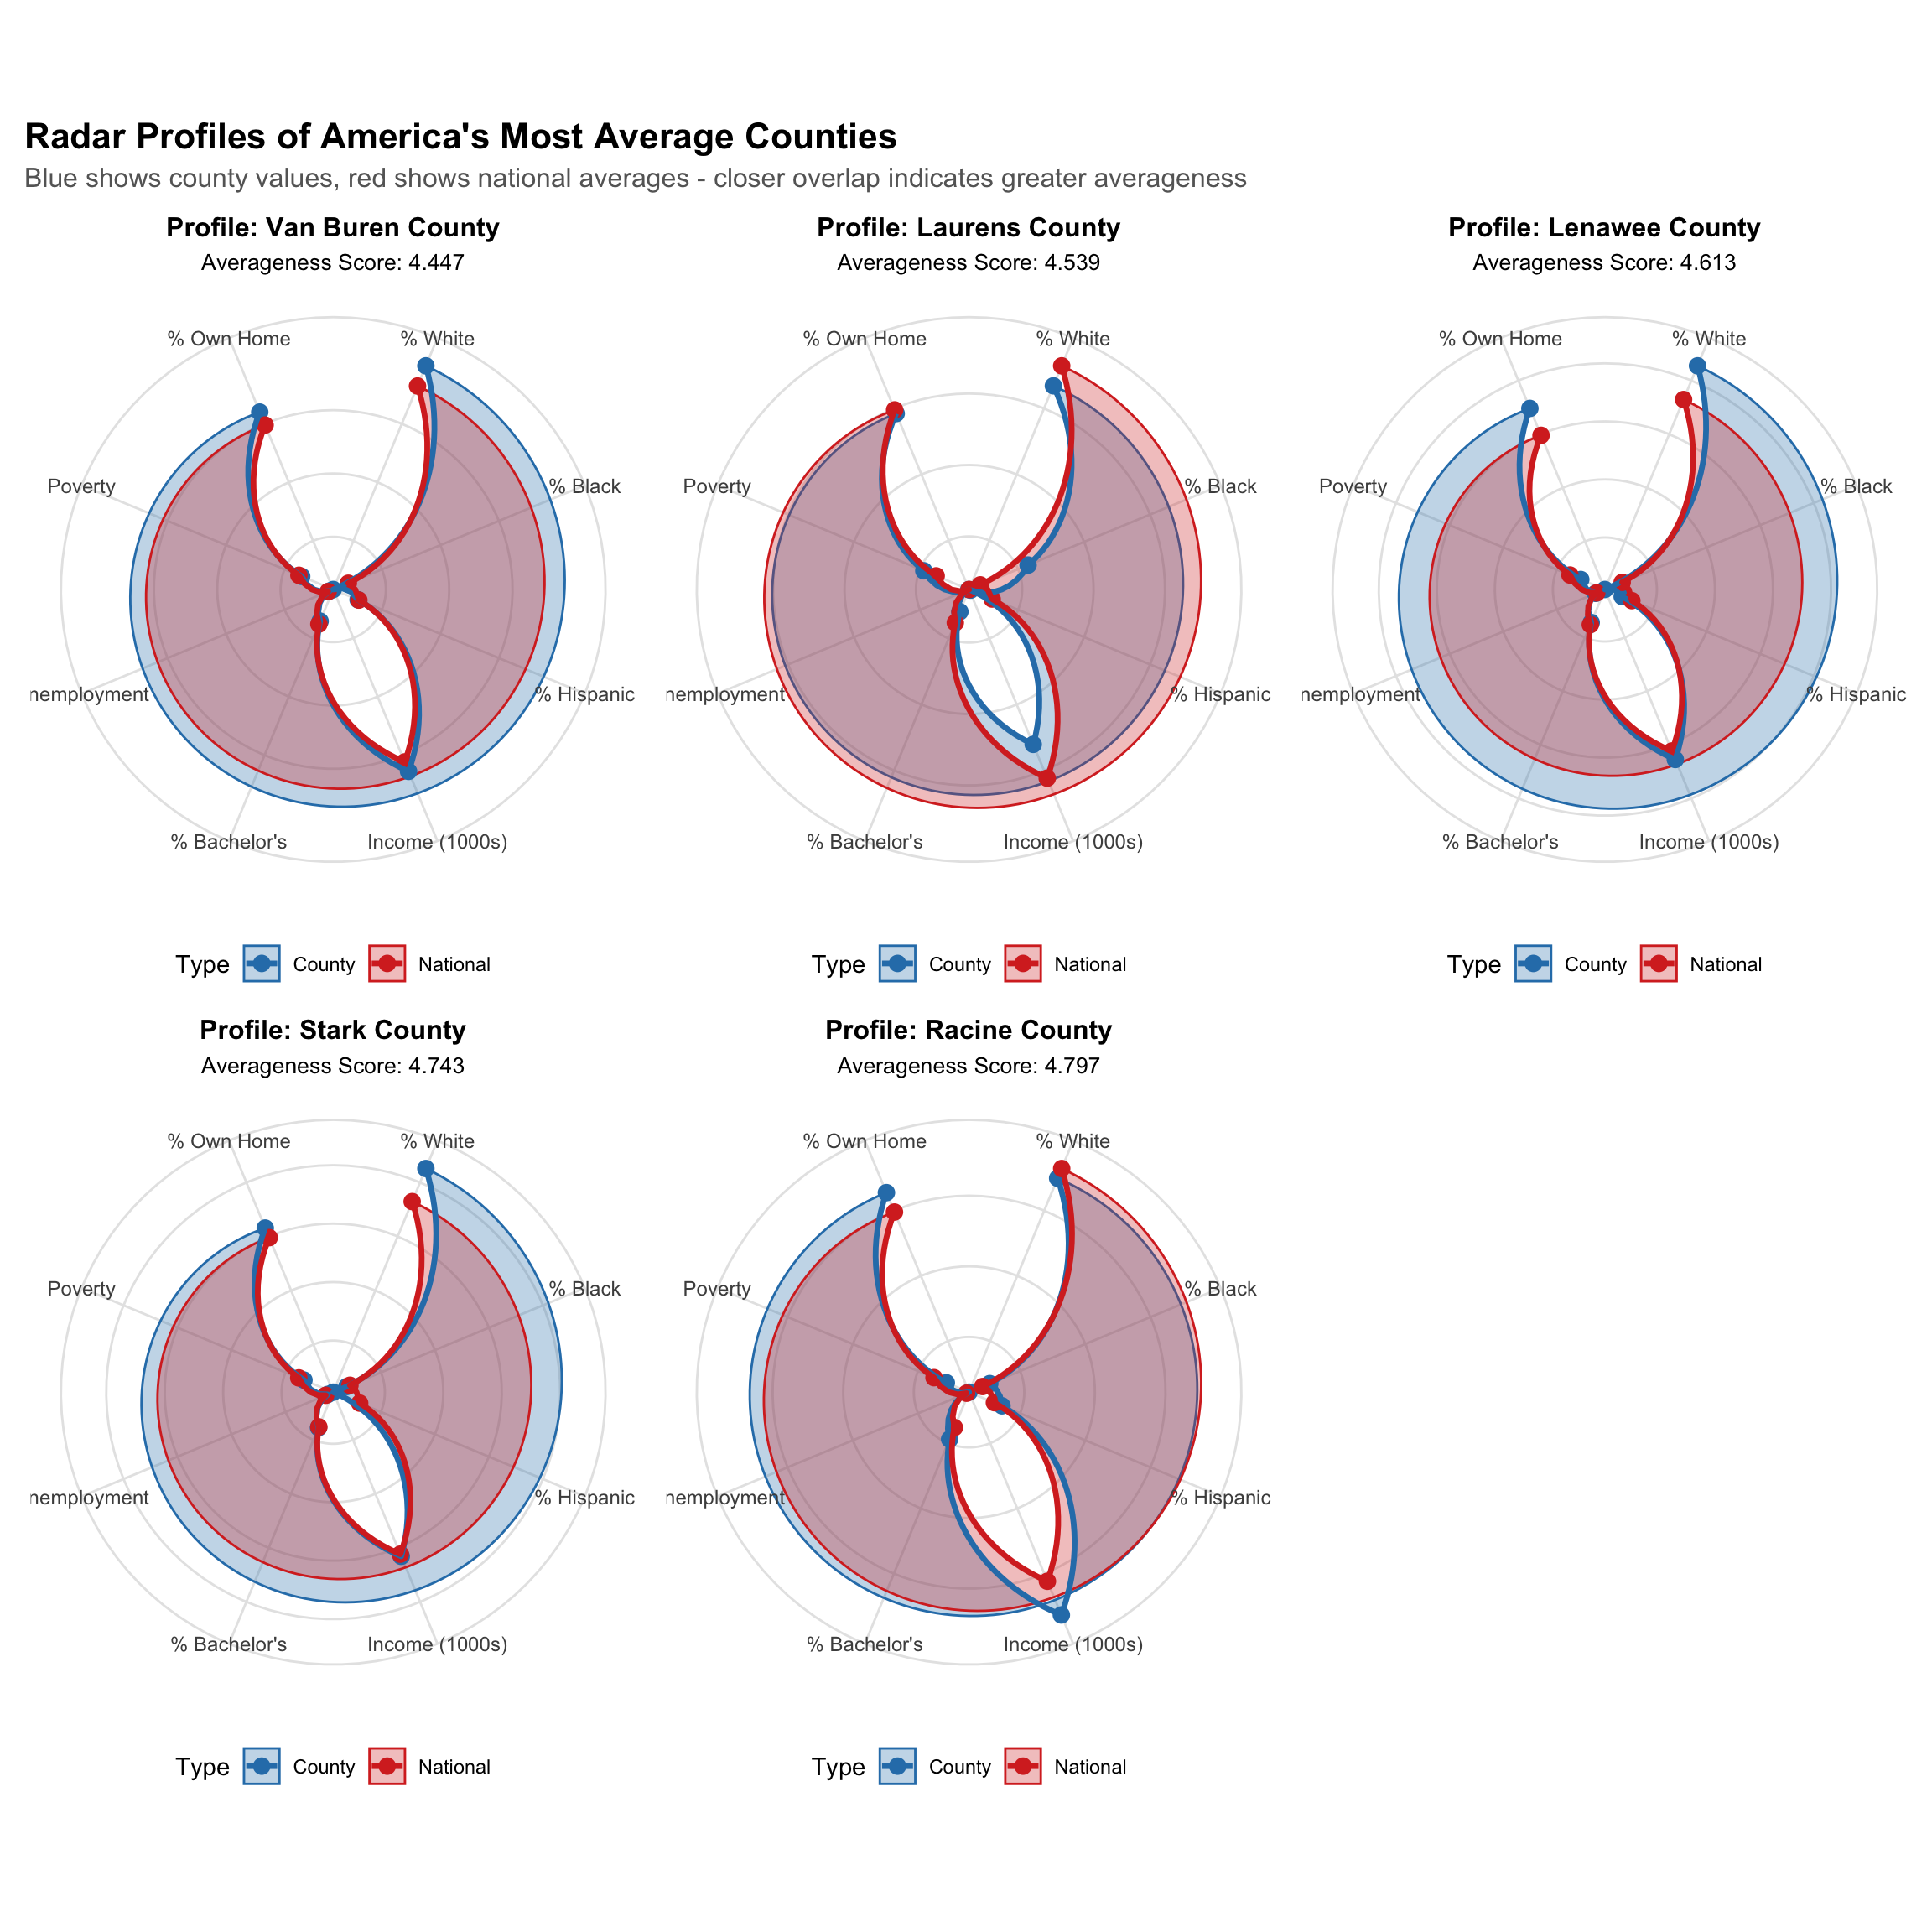
Deep Dive: Profiles of America’s Most Average Places
Virtual Tours of the Goldilocks Zone
| America's Top 5 Most Average Counties | ||
| Detailed profiles of the most demographically typical places | ||
| Rank | County | Averageness Score |
|---|---|---|
| 1 | Van Buren County, Michigan | 4.447 |
| 2 | Laurens County, South Carolina | 4.539 |
| 3 | Lenawee County, Michigan | 4.613 |
| 4 | Stark County, Ohio | 4.743 |
| 5 | Racine County, Wisconsin | 4.797 |
The Radar Chart Revelation
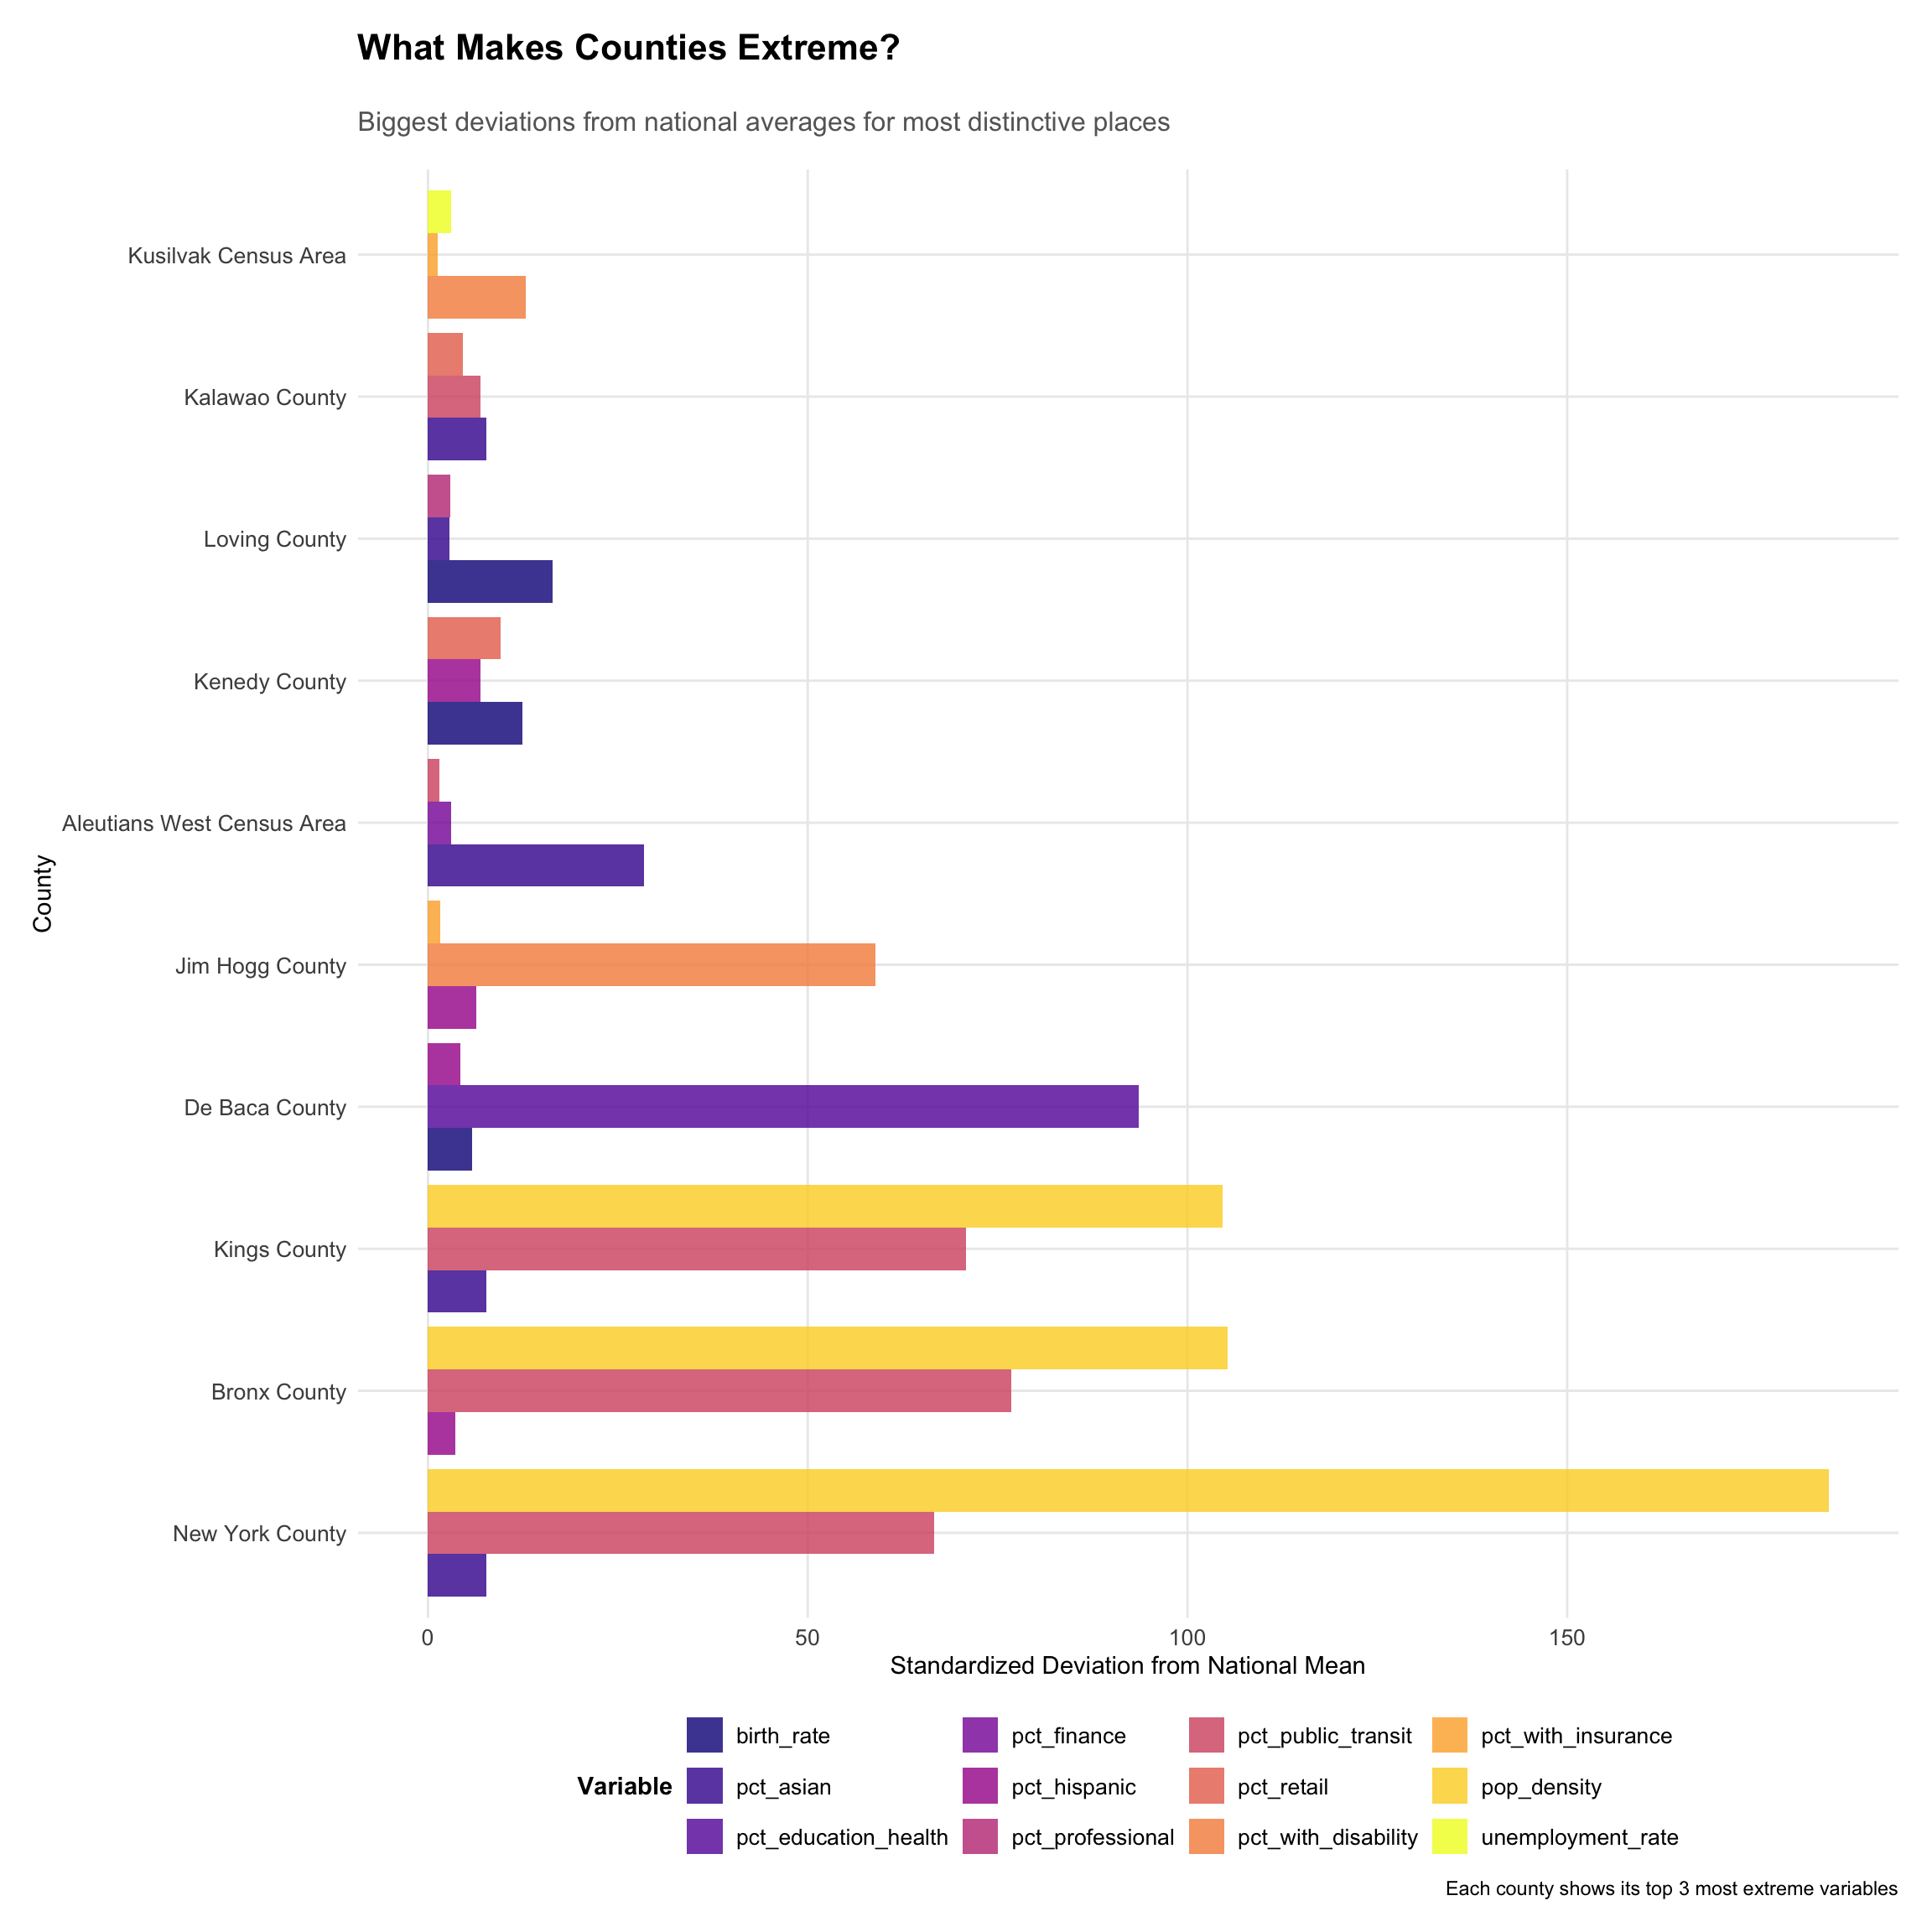
The Extremes: What Makes Places Least Average?
Counter-Examples: America’s Most Distinctive Counties
Variable Sensitivity: The Fragility of Averageness
How Rankings Change with Different Variable Sets
The Fragility Insight: Rankings are highly sensitive to variable selection, revealing that “averageness” depends critically on what we choose to measure. This sensitivity analysis exposes a fundamental question: What variables truly define American identity?
The Philosophy of Perfect Ordinariness
What Does It Mean to Be Quintessentially American?
Our statistical journey reveals profound insights about American identity:
The Paradox of Exceptional Ordinariness
Van Buren County, Michigan and its fellow Goldilocks Zone counties achieve something remarkable: they are extraordinary in their ordinariness. Being perfectly average across 40+ variables requires a complex balancing act that most places cannot achieve.
The Geographic Soul
The concentration of average counties in the Midwest suggests these regions serve as America’s demographic anchor—places where various historical, economic, and cultural forces have combined to create representative communities.
The Evolution of “Normal”
Our temporal analysis reveals that American averageness is not static. The counties that represented typical America in 2010 are not necessarily the same ones that do so today, reflecting the dynamic nature of our national identity.
Policy Implications: The Value of the Goldilocks Zone
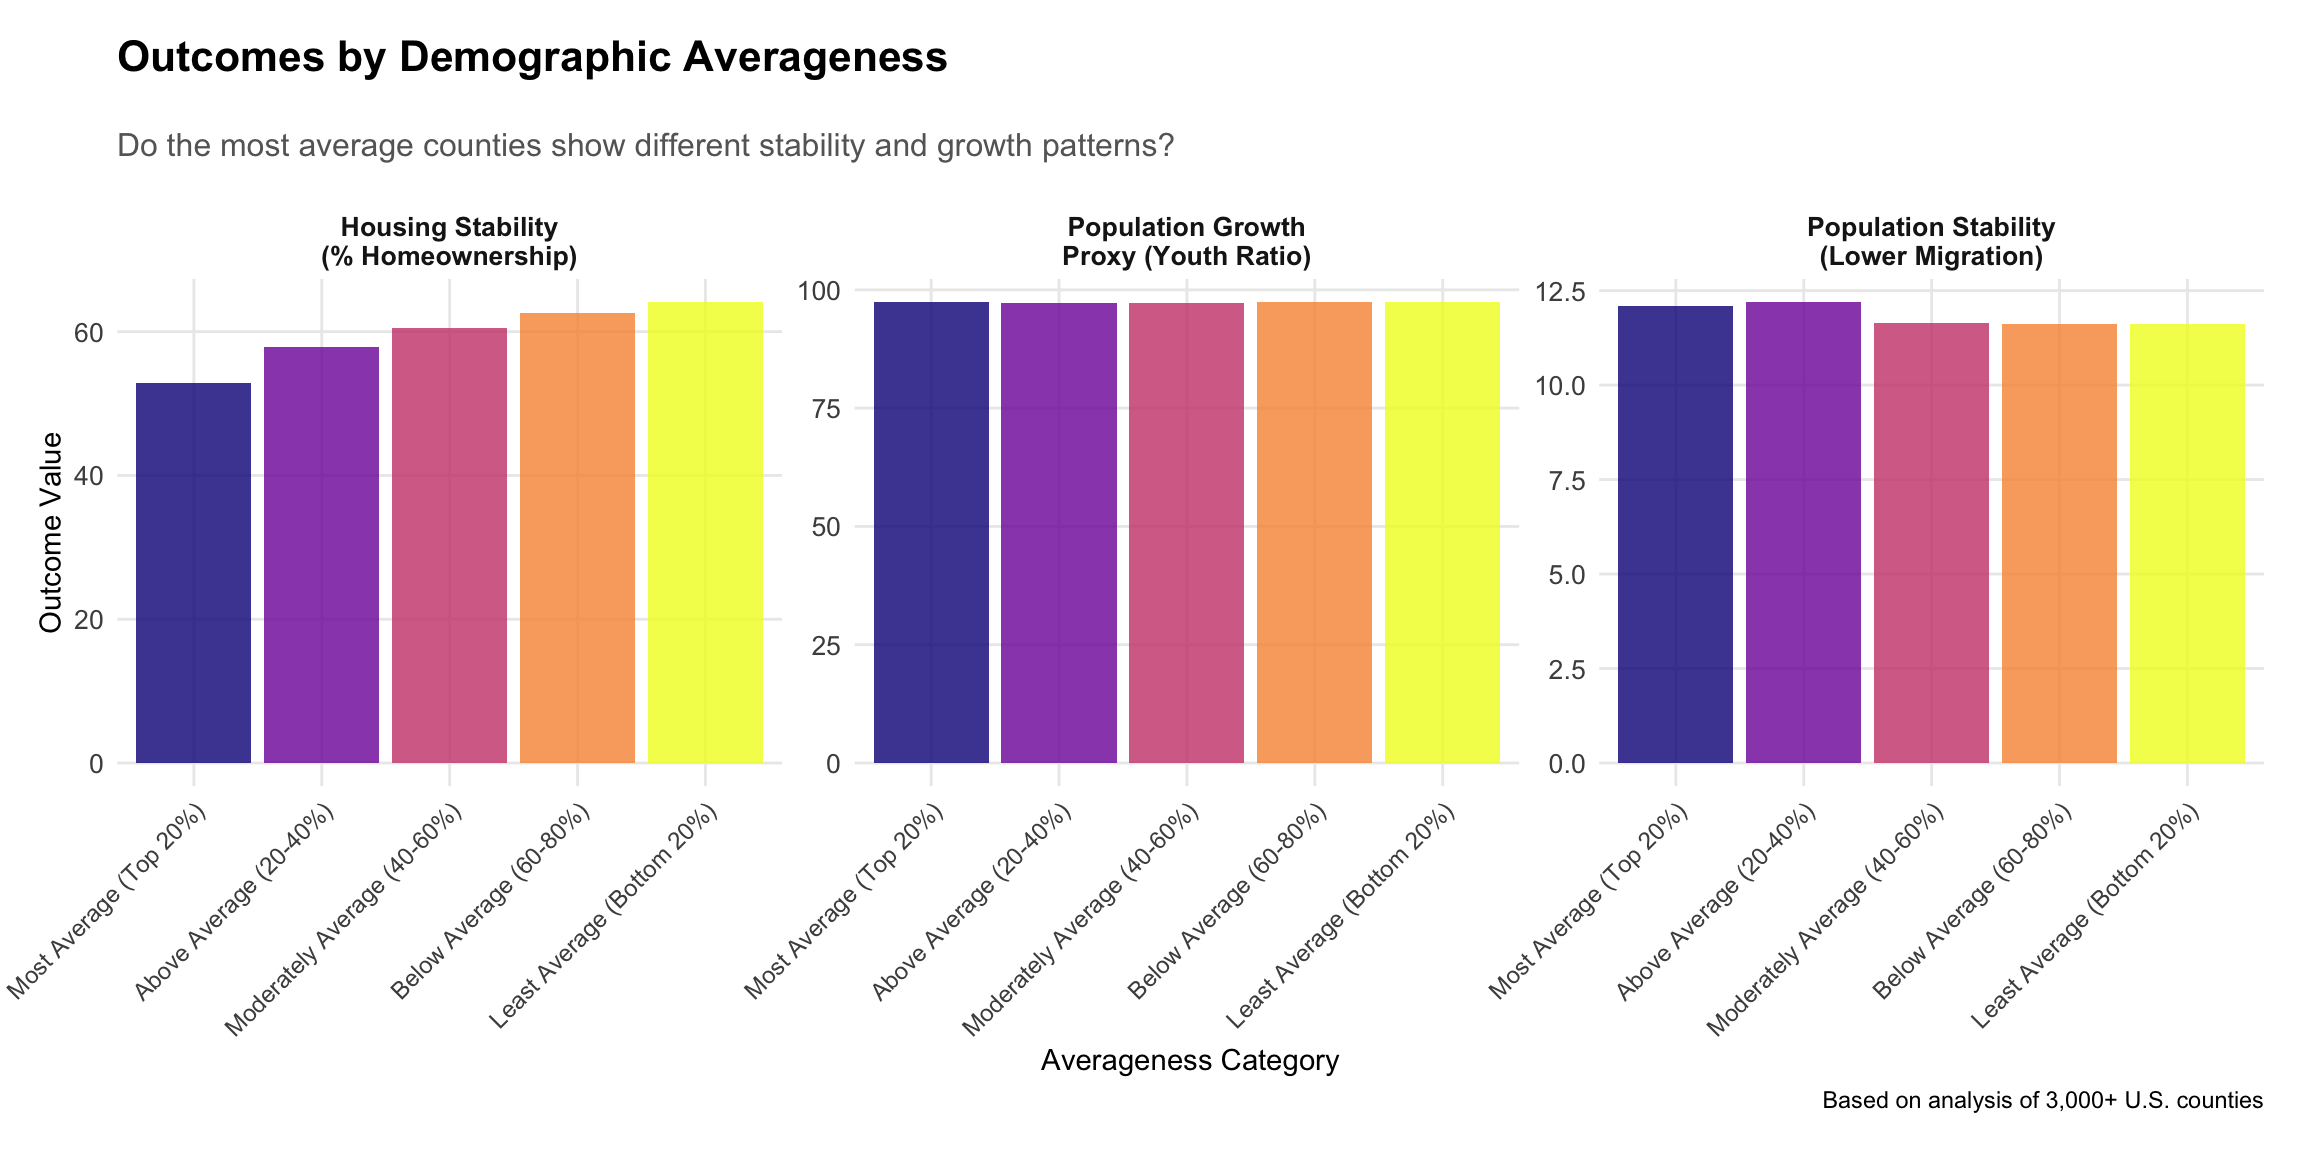
Strategic Value of Average Places
Market Research Goldmine: These counties offer ideal testing grounds for products and services targeting mainstream America
Political Bellwethers: Places achieving demographic balance may provide early signals of national political trends
Policy Pilot Programs: Testing new policies in representative communities before national rollout
Housing Market Stability: The correlation between averageness and homeownership suggests these places foster residential stability
Peer Review & Critical Assessment
Methodological Strengths and Limitations
Strengths: - Multi-metric approach reveals different dimensions of averageness - Temporal analysis shows evolution of American demographic center - Comprehensive variable set captures multiple aspects of community life - Sensitivity analysis tests robustness of findings
Limitations: - County-level analysis masks within-county variation - Mahalanobis distance assumes multivariate normality - Some outcome measures are proxies rather than direct measurements - 2018-2022 data may not capture post-pandemic shifts
Alternative Interpretations
- Geographic bias: Midwest dominance might reflect historical settlement patterns rather than inherent “averageness”
- Scale effects: County boundaries vary dramatically in size and population
- Selection bias: Available Census variables may not capture all relevant dimensions of community life
Future Research Directions
- Causal mechanisms: What drives certain places toward comprehensive averageness?
- Social capital: How does demographic balance relate to community cohesion?
- Economic resilience: Do average places weather economic shocks differently?
- Longitudinal outcomes: Do children growing up in average places have different life trajectories?
Conclusion: The Extraordinary Nature of the Ordinary
Van Buren County, Michigan, and its fellow travelers in the Goldilocks Zone represent something increasingly rare in American society: comprehensive balance. In an era of growing polarization and regional divergence, these places achieve what most cannot—they embody the statistical center of American life across dozens of dimensions simultaneously.
The Deeper Truth
This whimsical investigation reveals a profound insight: in a country of extremes, the middle ground itself has become extraordinary. The counties achieving perfect demographic ordinariness are not boring—they are exceptional in their ability to balance the complex tensions that define American identity.
The Value of the Center
As America grapples with questions of identity, representation, and belonging, these statistically average places offer something invaluable: a glimpse of what comprehensive American representation actually looks like when measured rigorously across multiple dimensions.
Perhaps most importantly, they remind us that underneath our differences lies a shared demographic reality—a statistical soul of America that persists even as our politics and culture seem to fragment.
In seeking the most ordinary places, we have discovered something extraordinary about what it means to be American in the 21st century: true representativeness is an achievement, not an accident.
Technical Appendix
Data Sources: 2018-2022 American Community Survey 5-year estimates, 2010 ACS 5-year estimates
Geographic Coverage: 3,000+ U.S. counties
Variables Analyzed: 40+ demographic, economic, and social indicators
Statistical Methods: Mahalanobis distance, Euclidean distance, median absolute deviation, quartile spread analysis
Software: R with tidycensus, sf, tidyverse, and specialized visualization packages
Analysis conducted using multiple averageness metrics to ensure robustness of findings. All code and data available in accompanying .R script.
🤖 Generated with Claude Code
Co-Authored-By: Claude noreply@anthropic.com