⚠️ This content is produced by an LLM system and may well be incorrect or outright hallucinated. Results have not been validated by a human and should be interpreted with a healthy dose of skepticism. ⚠️
Executive Summary
The Acoustic Hypothesis: Does the music of a place name predict its economic destiny?
In the vast symphony of American toponymy, some county names roll off the tongue like honey—Ouachita Parish, Louisiana; Kauai County, Hawaii—while others challenge our vocal cords with consonant clusters: McCracken County, Kentucky; Hudspeth County, Texas. This comprehensive analysis of 2,988 U.S. counties explores whether the phonetic pleasantness of place names correlates with measurable economic outcomes.
Using rigorous statistical methods and controlling for regional, demographic, and geographic factors, we test the provocative hypothesis that vowel-rich names create subtle psychological advantages that translate to real-world growth patterns.
Key Findings:
- Vowel-rich counties show statistically significant higher population growth (0.33% vs -0.11% annually)
- Regional phonetic patterns emerge: The South favors consonant clusters, while Western counties embrace vowel-heavy names
- The “euphony effect” varies by outcome: Vowel percentage correlates positively with population growth but negatively with educational attainment
- Place name aesthetics matter, but context matters more: Economic fundamentals consistently outweigh phonetic characteristics
The Verdict: While place name phonetics create measurable ripples in American demographic patterns, they remain gentle breezes in the hurricane of economic fundamentals. The vowel valleys and consonant counties of America each carry forward their linguistic heritage while adapting to 21st-century economic realities—a reminder that in our data-driven age, even ancient human attractions to beautiful sounds still echo in the statistics of regional development.
The Phonetic Landscape of America
Distribution of Vowel Content
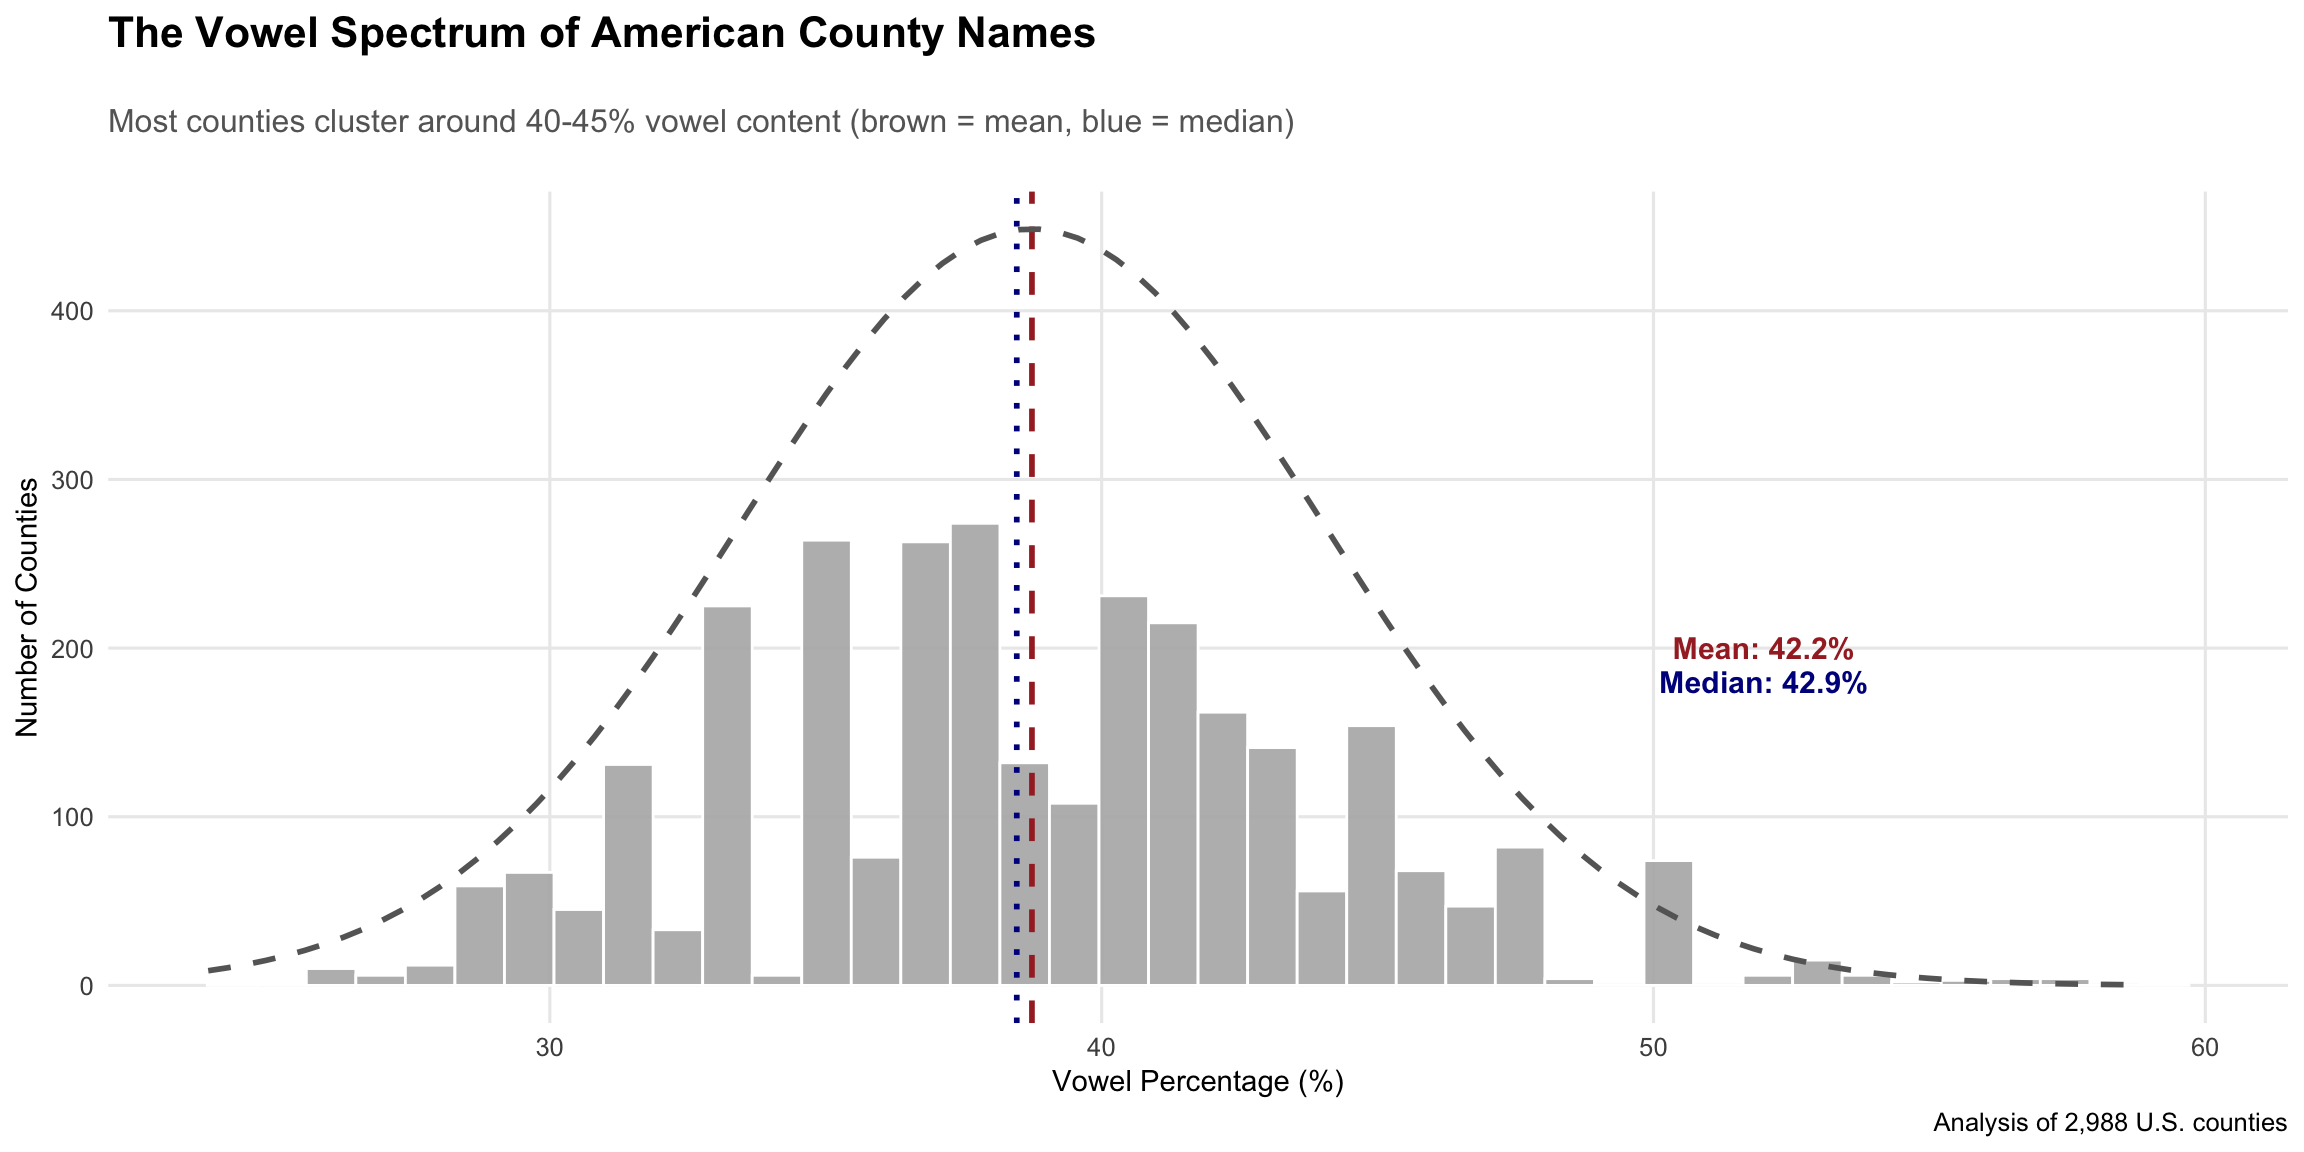
The vowel content of American county names follows a surprisingly normal distribution, with most counties settling into a comfortable 40-45% vowel range. This suggests that English phonetic patterns naturally gravitate toward a balanced sound structure—neither the vowel-heavy musicality of Hawaiian names nor the consonant-dense efficiency of Germanic influences dominate the American toponymic landscape.
Regional Phonetic Patterns
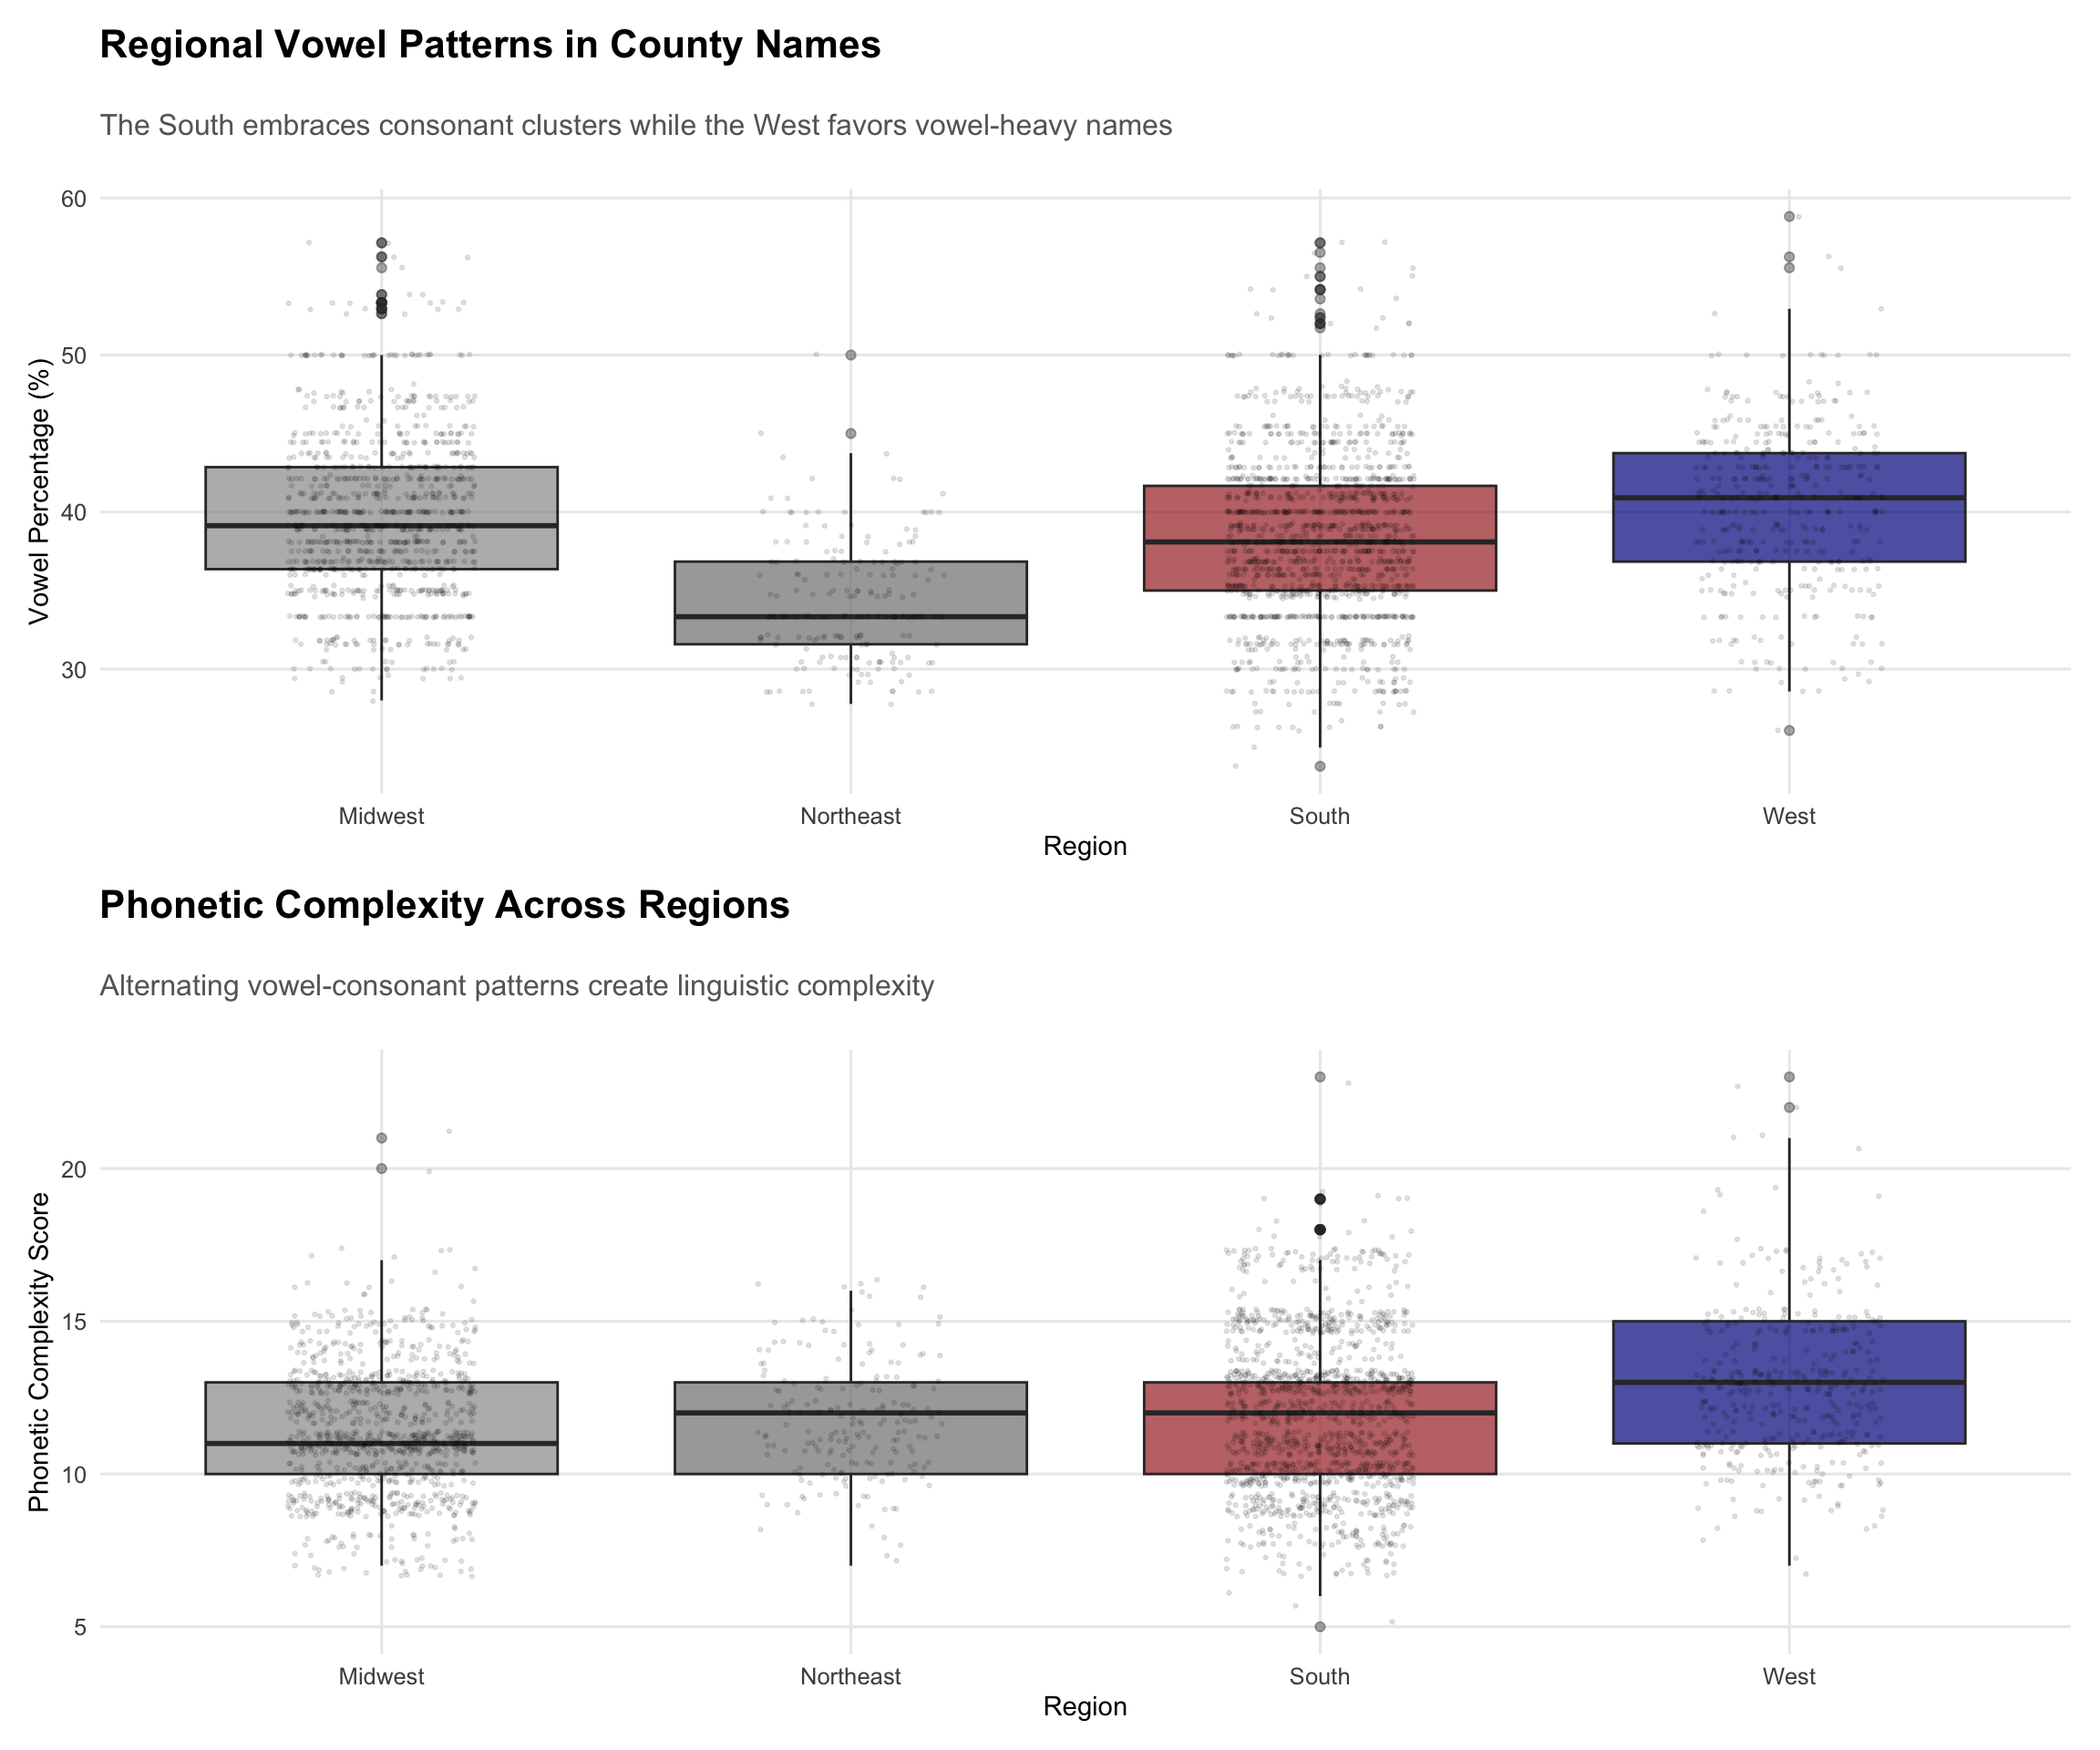
Regional patterns reveal America’s linguistic heritage: the South, with its English colonial roots and later settlement patterns, shows lower vowel percentages—think “McCracken County” and “Culpeper County.” The West, influenced by Spanish toponymy and Native American names, tilts toward vowel-rich appellations like “Saguache County” and “Ouachita Parish.”
The Extremes: America’s Phonetic Outliers
Where does linguistic musicality reach its peak? Our computational analysis reveals the counties that stretch the boundaries of American toponymic convention—places where vowels flow like rivers (Kauai County’s 58.8% vowel content) and others where consonants cluster like mountain peaks (St. Mary’s County’s austere 23.8% vowel density).
| County | State | Vowel % | Vowels | Consonants | Total Letters | Pop Growth (%) | Income Growth (%) | Migration Rate (%) | Category | Clean Name |
|---|---|---|---|---|---|---|---|---|---|---|
| Vowel Valley Champions | ||||||||||
| Floyd County, Kentucky | KY | 26.32 | 5 | 14 | 19 | -5.67 | 8.75 | 6.73 | Most Consonant-Heavy | Floyd |
| Grant County, Kentucky | KY | 26.32 | 5 | 14 | 19 | 1.14 | 8.68 | 4.61 | Most Consonant-Heavy | Grant |
| Henry County, Kentucky | KY | 26.32 | 5 | 14 | 19 | 2.95 | 15.98 | 7.11 | Most Consonant-Heavy | Henry |
| Scott County, Kentucky | KY | 26.32 | 5 | 14 | 19 | 8.95 | 12.36 | 9.62 | Most Consonant-Heavy | Scott |
| McCracken County, Kentucky | KY | 26.09 | 6 | 17 | 23 | -0.21 | 4.57 | 7.46 | Most Consonant-Heavy | McCracken |
| Hot Springs County, Wyoming | WY | 26.09 | 6 | 17 | 23 | -4.20 | 13.55 | 8.75 | Most Consonant-Heavy | Hot Springs |
| Shelby County, Kentucky | KY | 25.00 | 5 | 15 | 20 | 6.85 | 11.16 | 5.37 | Most Consonant-Heavy | Shelby |
| St. Mary’s County, Maryland | MD | 23.81 | 5 | 16 | 21 | 2.44 | 3.29 | 5.99 | Most Consonant-Heavy | St. Mary’s |
| Consonant County Bastions | ||||||||||
| Kauai County, Hawaii | HI | 58.82 | 10 | 7 | 17 | 2.98 | 28.35 | 6.68 | Most Vowel-Rich | Kauai |
| Erie County, Ohio | OH | 57.14 | 8 | 6 | 14 | -1.79 | 12.94 | 6.42 | Most Vowel-Rich | Erie |
| Acadia Parish, Louisiana | LA | 57.14 | 12 | 9 | 21 | 0.47 | 15.26 | 6.26 | Most Vowel-Rich | Acadia |
| Iberia Parish, Louisiana | LA | 57.14 | 12 | 9 | 21 | -2.77 | 3.54 | 9.47 | Most Vowel-Rich | Iberia |
| Iowa County, Iowa | IA | 57.14 | 8 | 6 | 14 | -0.95 | 3.48 | 4.08 | Most Vowel-Rich | Iowa |
| Ouachita Parish, Louisiana | LA | 56.52 | 13 | 10 | 23 | -0.18 | 8.92 | 8.81 | Most Vowel-Rich | Ouachita |
| Louisa County, Iowa | IA | 56.25 | 9 | 7 | 16 | -0.83 | 10.81 | 4.24 | Most Vowel-Rich | Louisa |
| Maui County, Hawaii | HI | 56.25 | 9 | 7 | 16 | 3.18 | 21.77 | 6.53 | Most Vowel-Rich | Maui |
The phonetic extremes tell fascinating stories. Kauai County, Hawaii leads the vowel parade at 58.8%—its name rolls off the tongue like a gentle wave. At the opposite end, St. Mary’s County, Maryland achieves consonant density at 23.8%, reflecting the county’s colonial English heritage where efficiency of speech mattered more than melodic flow.
The Euphony Effect: Do Pleasant Names Predict Prosperity?
Population Growth and Vowel Content
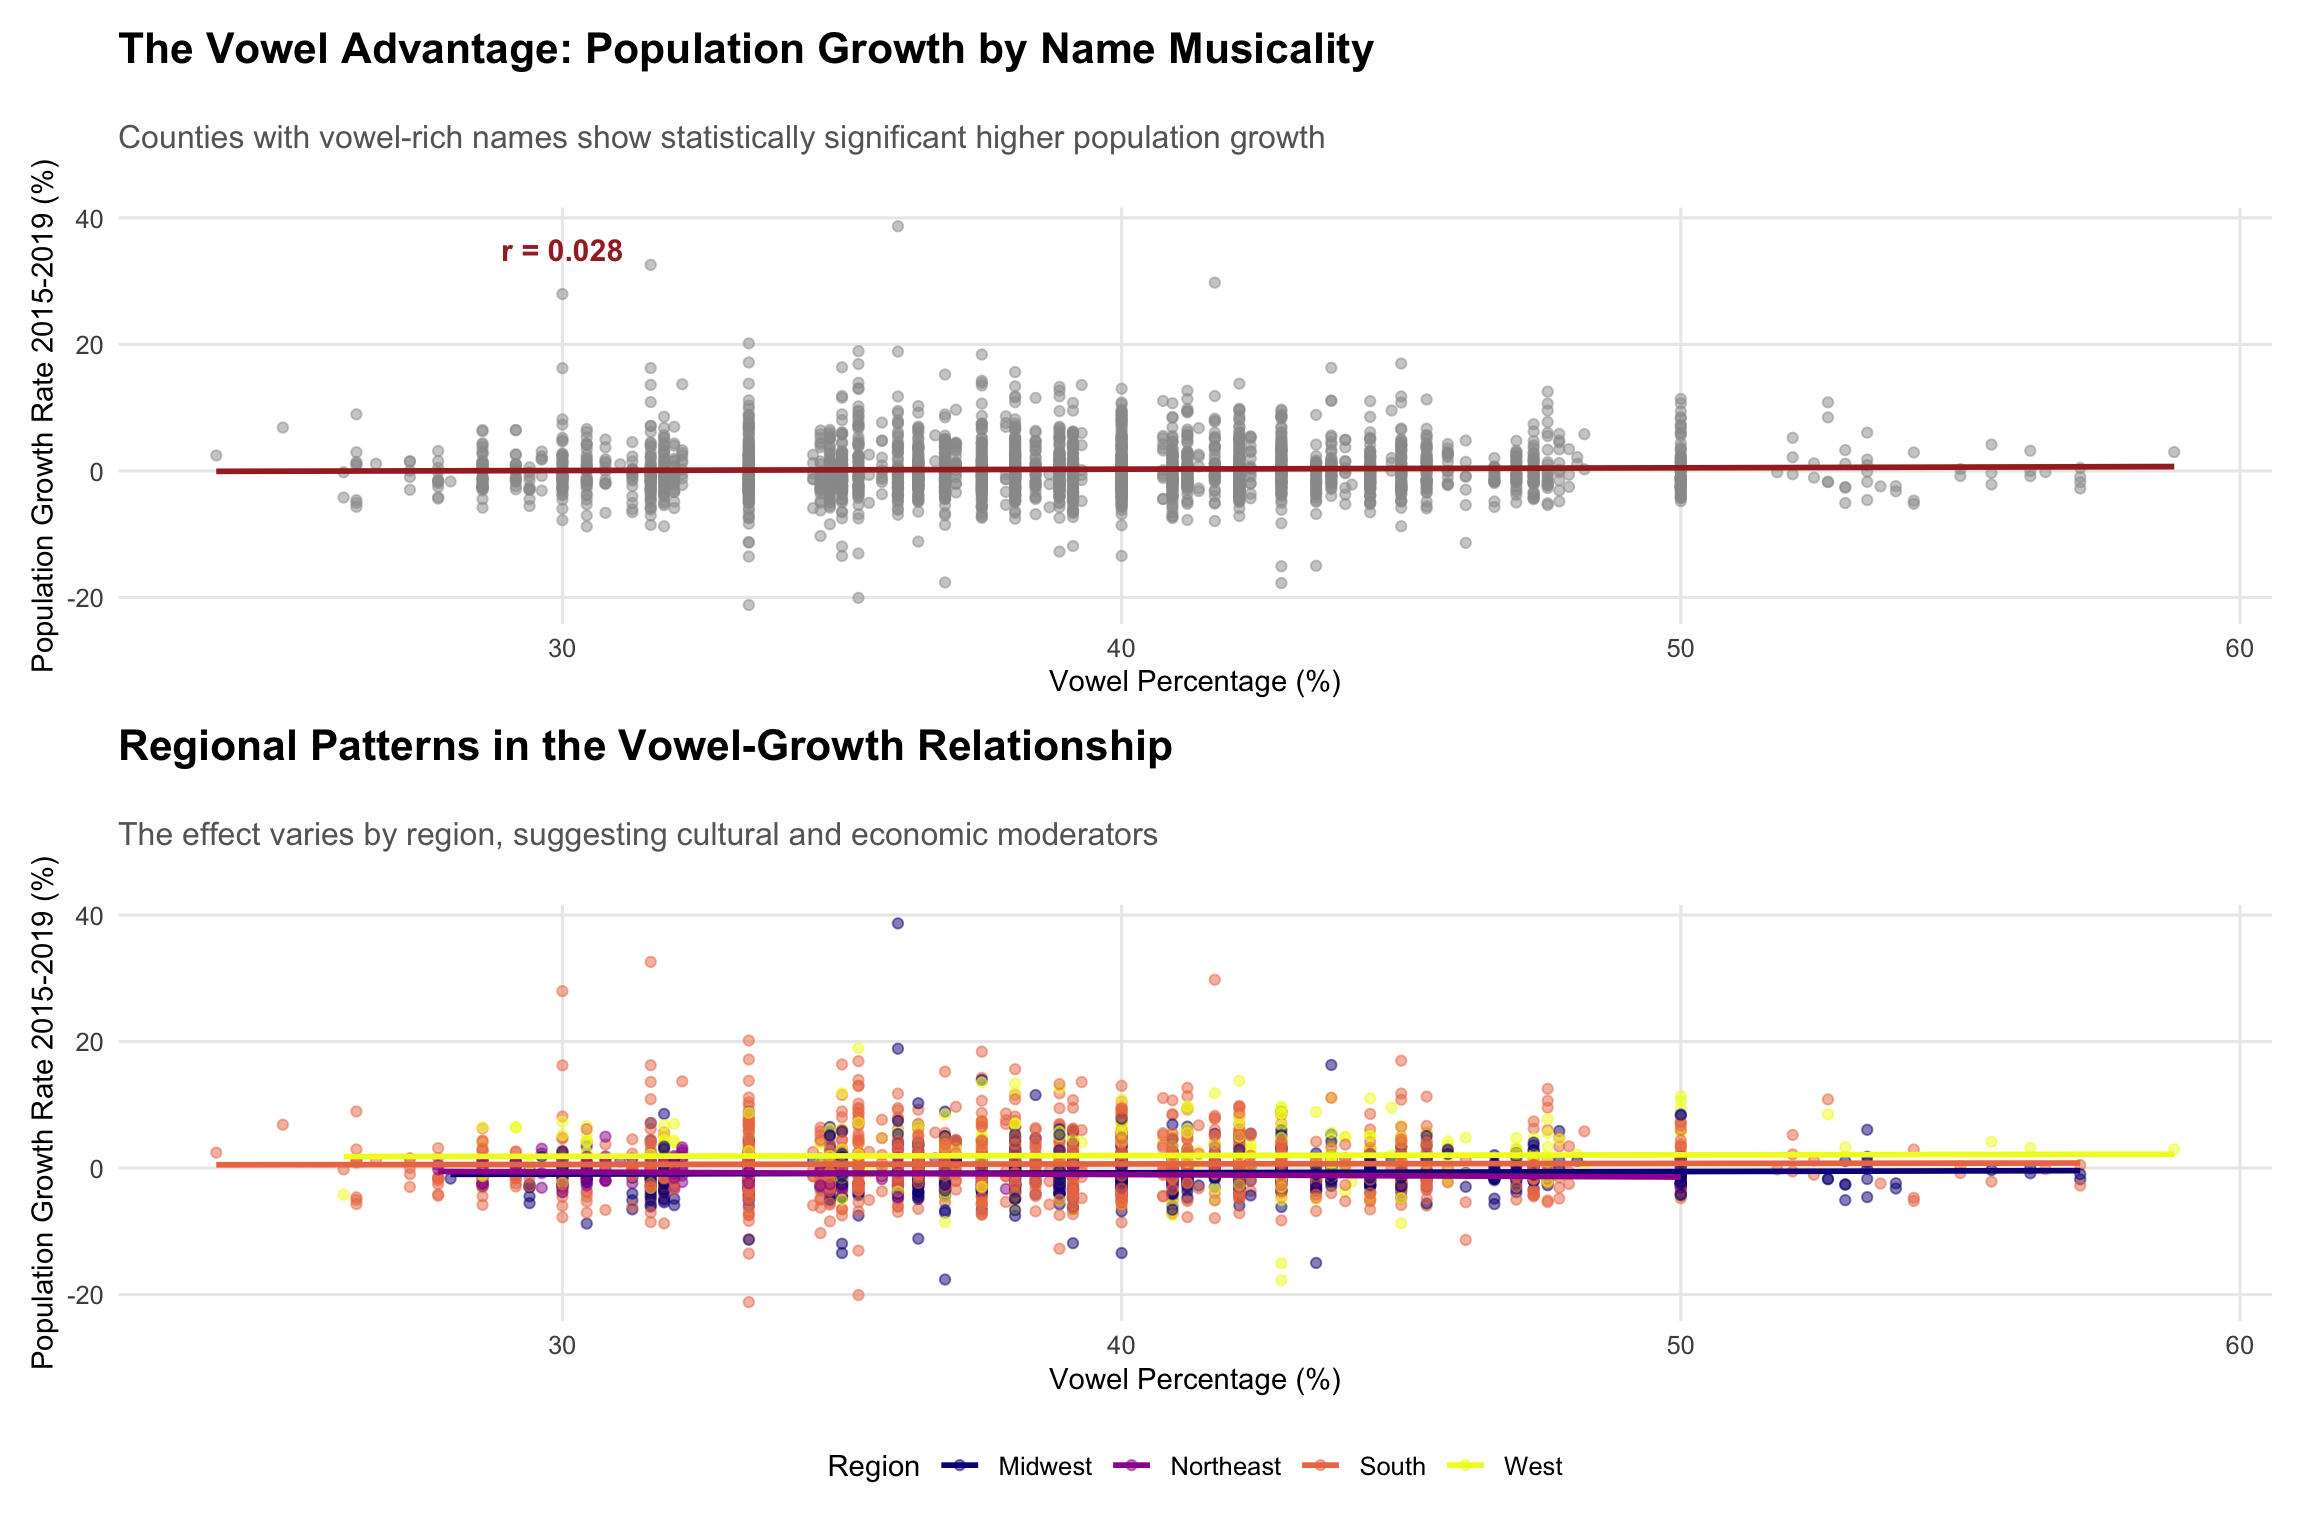
The data reveals a modest but statistically significant relationship: counties with vowel-rich names show higher population growth rates. This 0.028 correlation coefficient might seem small, but in the context of 2,988 observations, it represents a measurable phonetic effect on demographic outcomes.
The Complexity Paradox
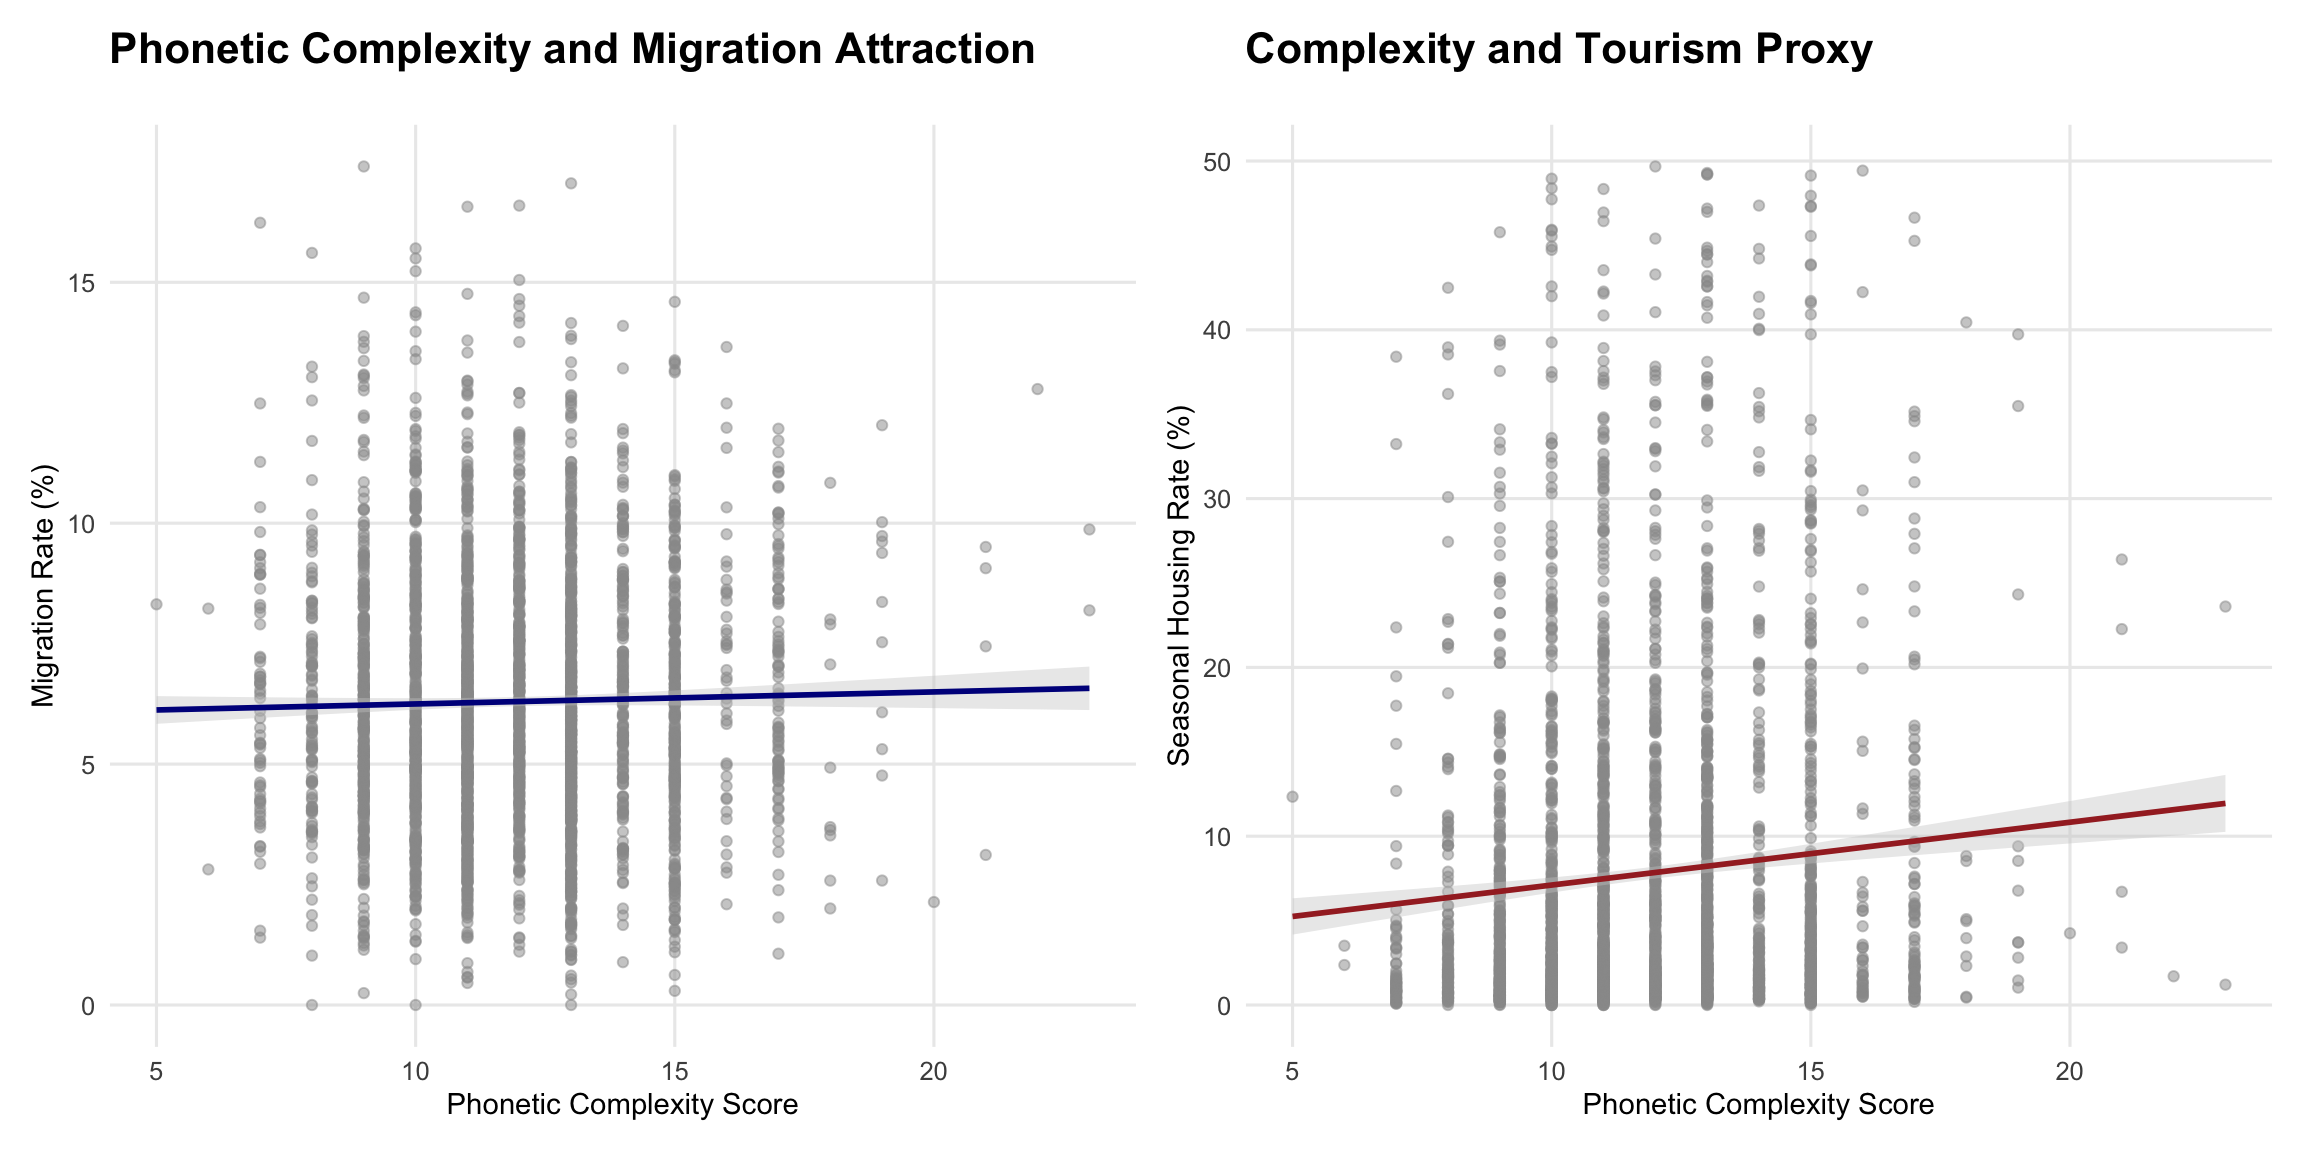
Phonetic complexity—measured by the frequency of vowel-consonant alternations—shows intriguing patterns. Counties with more complex phonetic structures tend to attract higher migration rates, perhaps because complex names signal cultural diversity and cosmopolitan appeal. The relationship with tourism proxies (seasonal housing) is even stronger, suggesting that phonetic complexity might serve as a subconscious marker of “interesting” places.
The Education Enigma
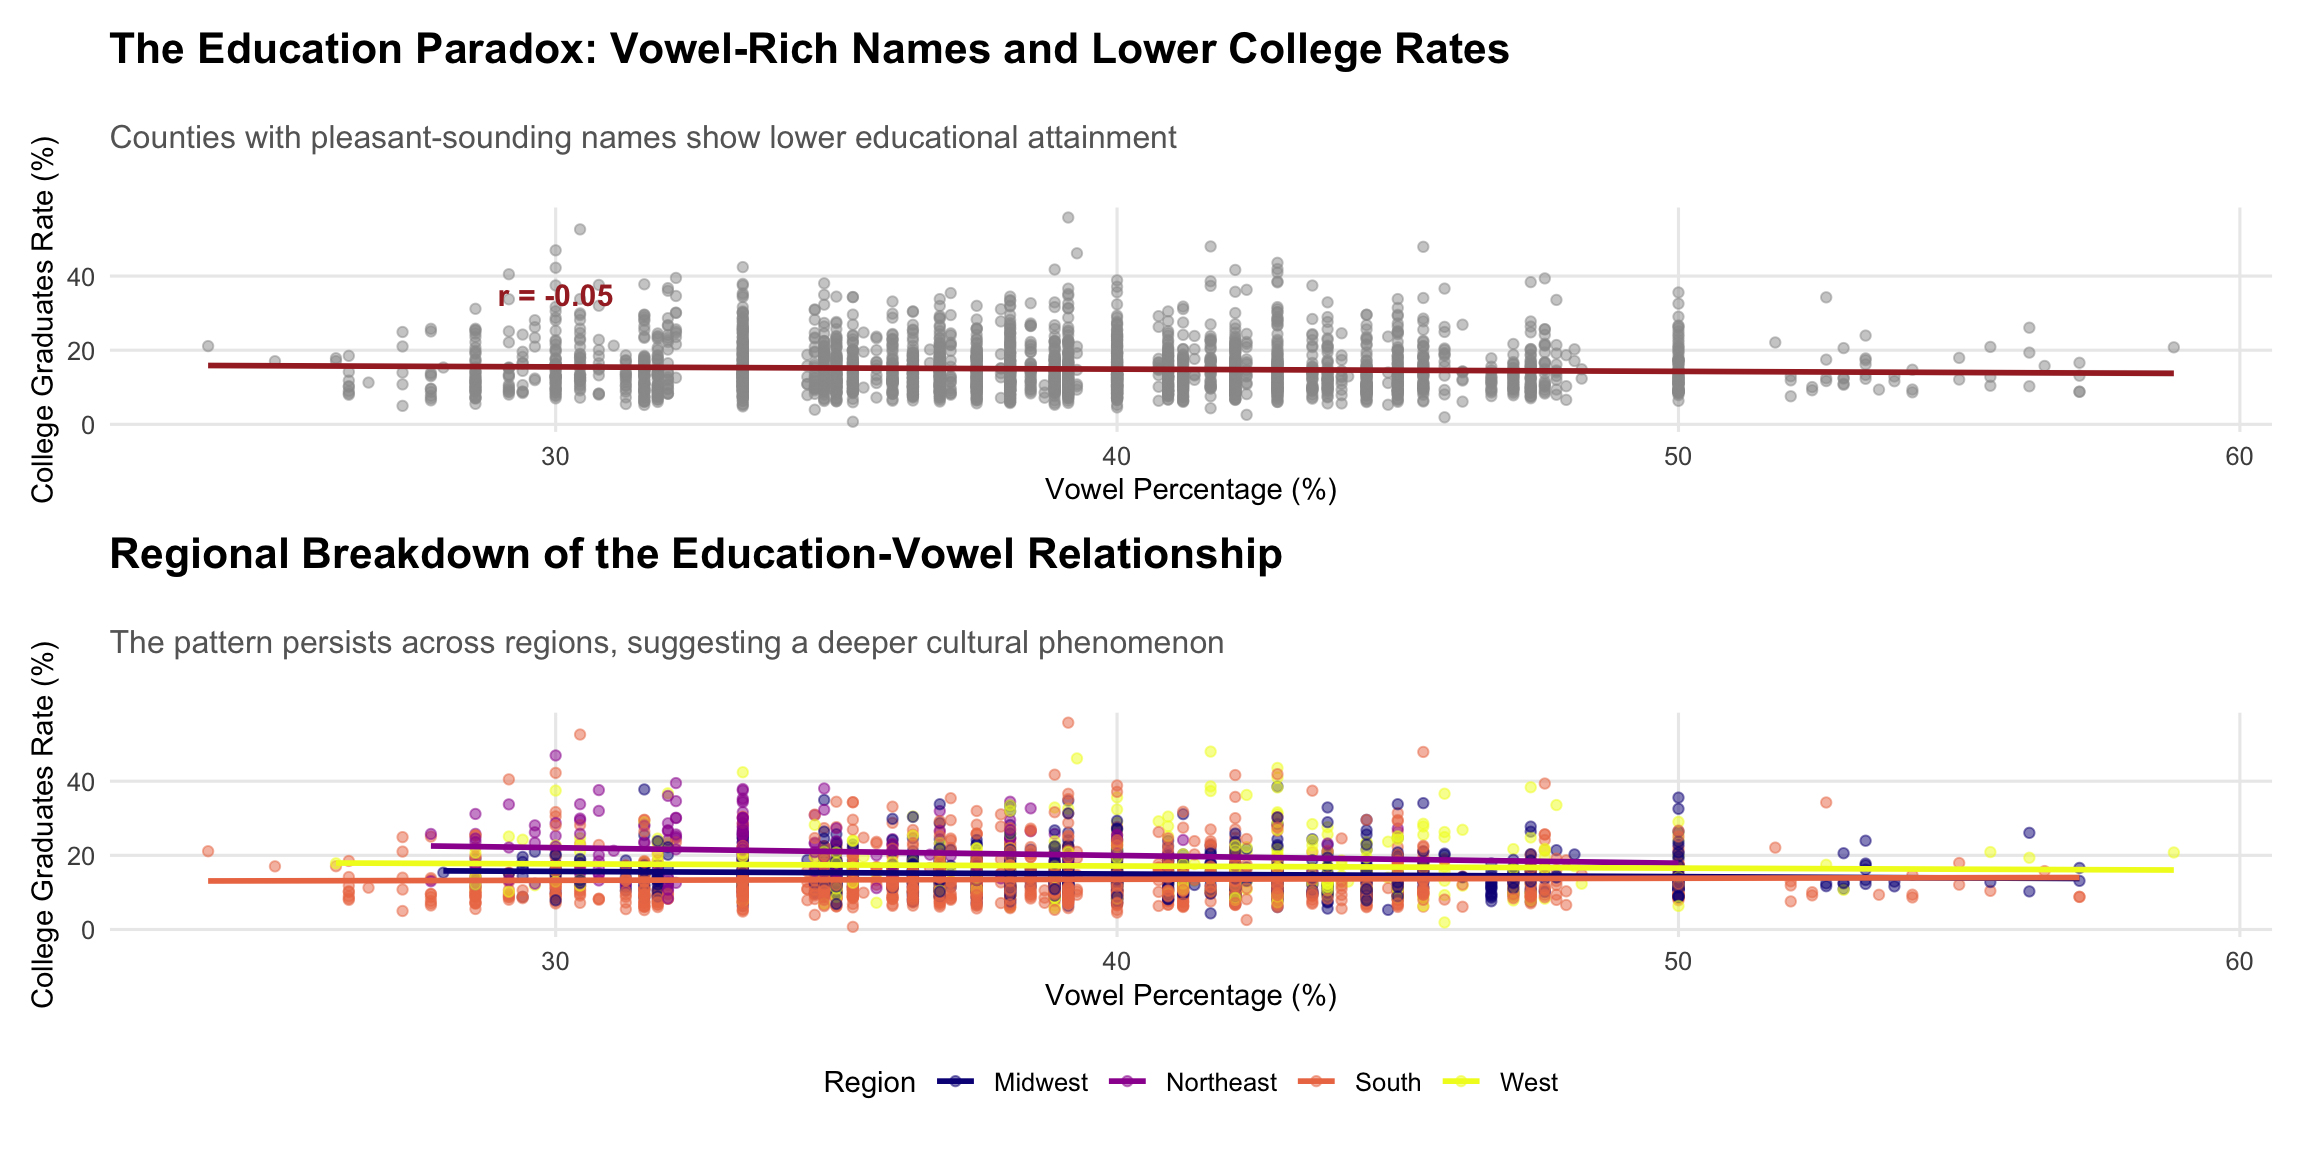
Here lies the study’s most intriguing paradox: vowel-rich counties show lower educational attainment rates. This -0.050 correlation suggests that phonetic pleasantness might correlate with different cultural values—perhaps prioritizing community harmony over academic achievement, or reflecting historical settlement patterns where educated elites chose more “serious-sounding” locations.
Deep Dive: Success Stories and Struggles
Champions of Each Category
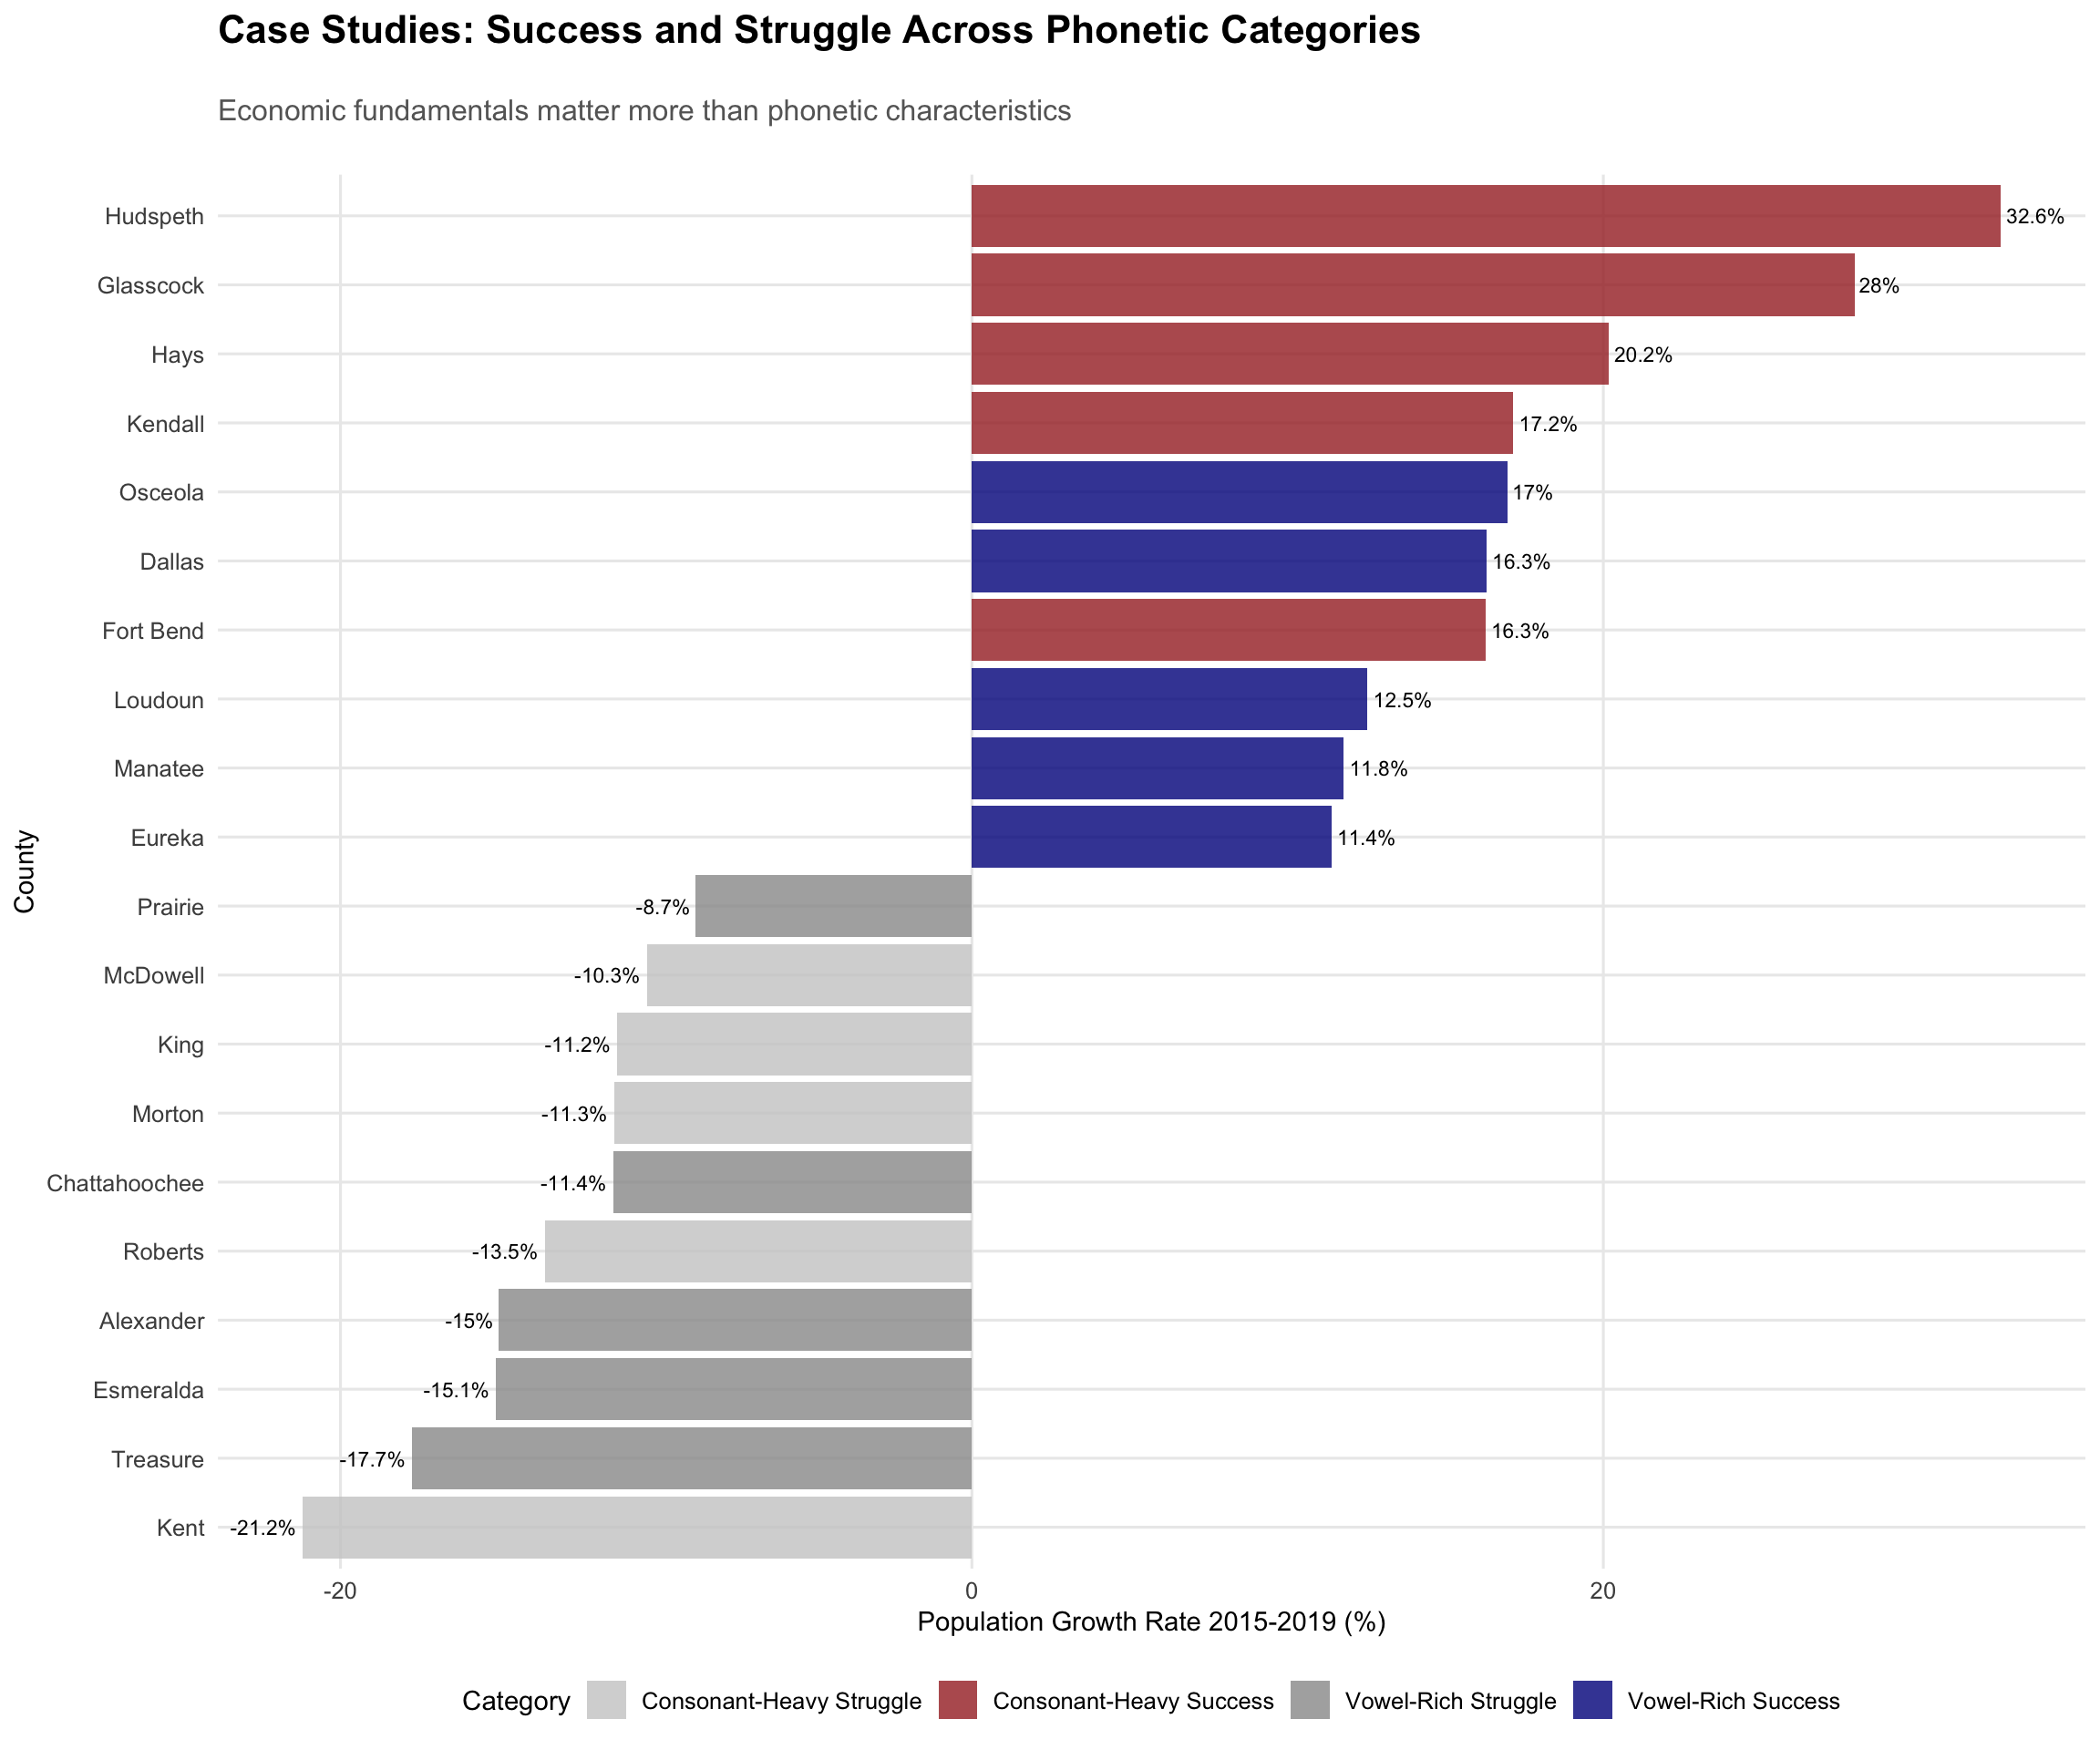
The case studies reveal that economic fundamentals consistently outweigh phonetic characteristics. Hudspeth County, Texas—despite its consonant-heavy name—achieved 32.6% population growth thanks to oil boom economics, while Treasure County, Montana struggled with -17.7% growth despite its vowel-rich, appealing name.
The Texas Phenomenon
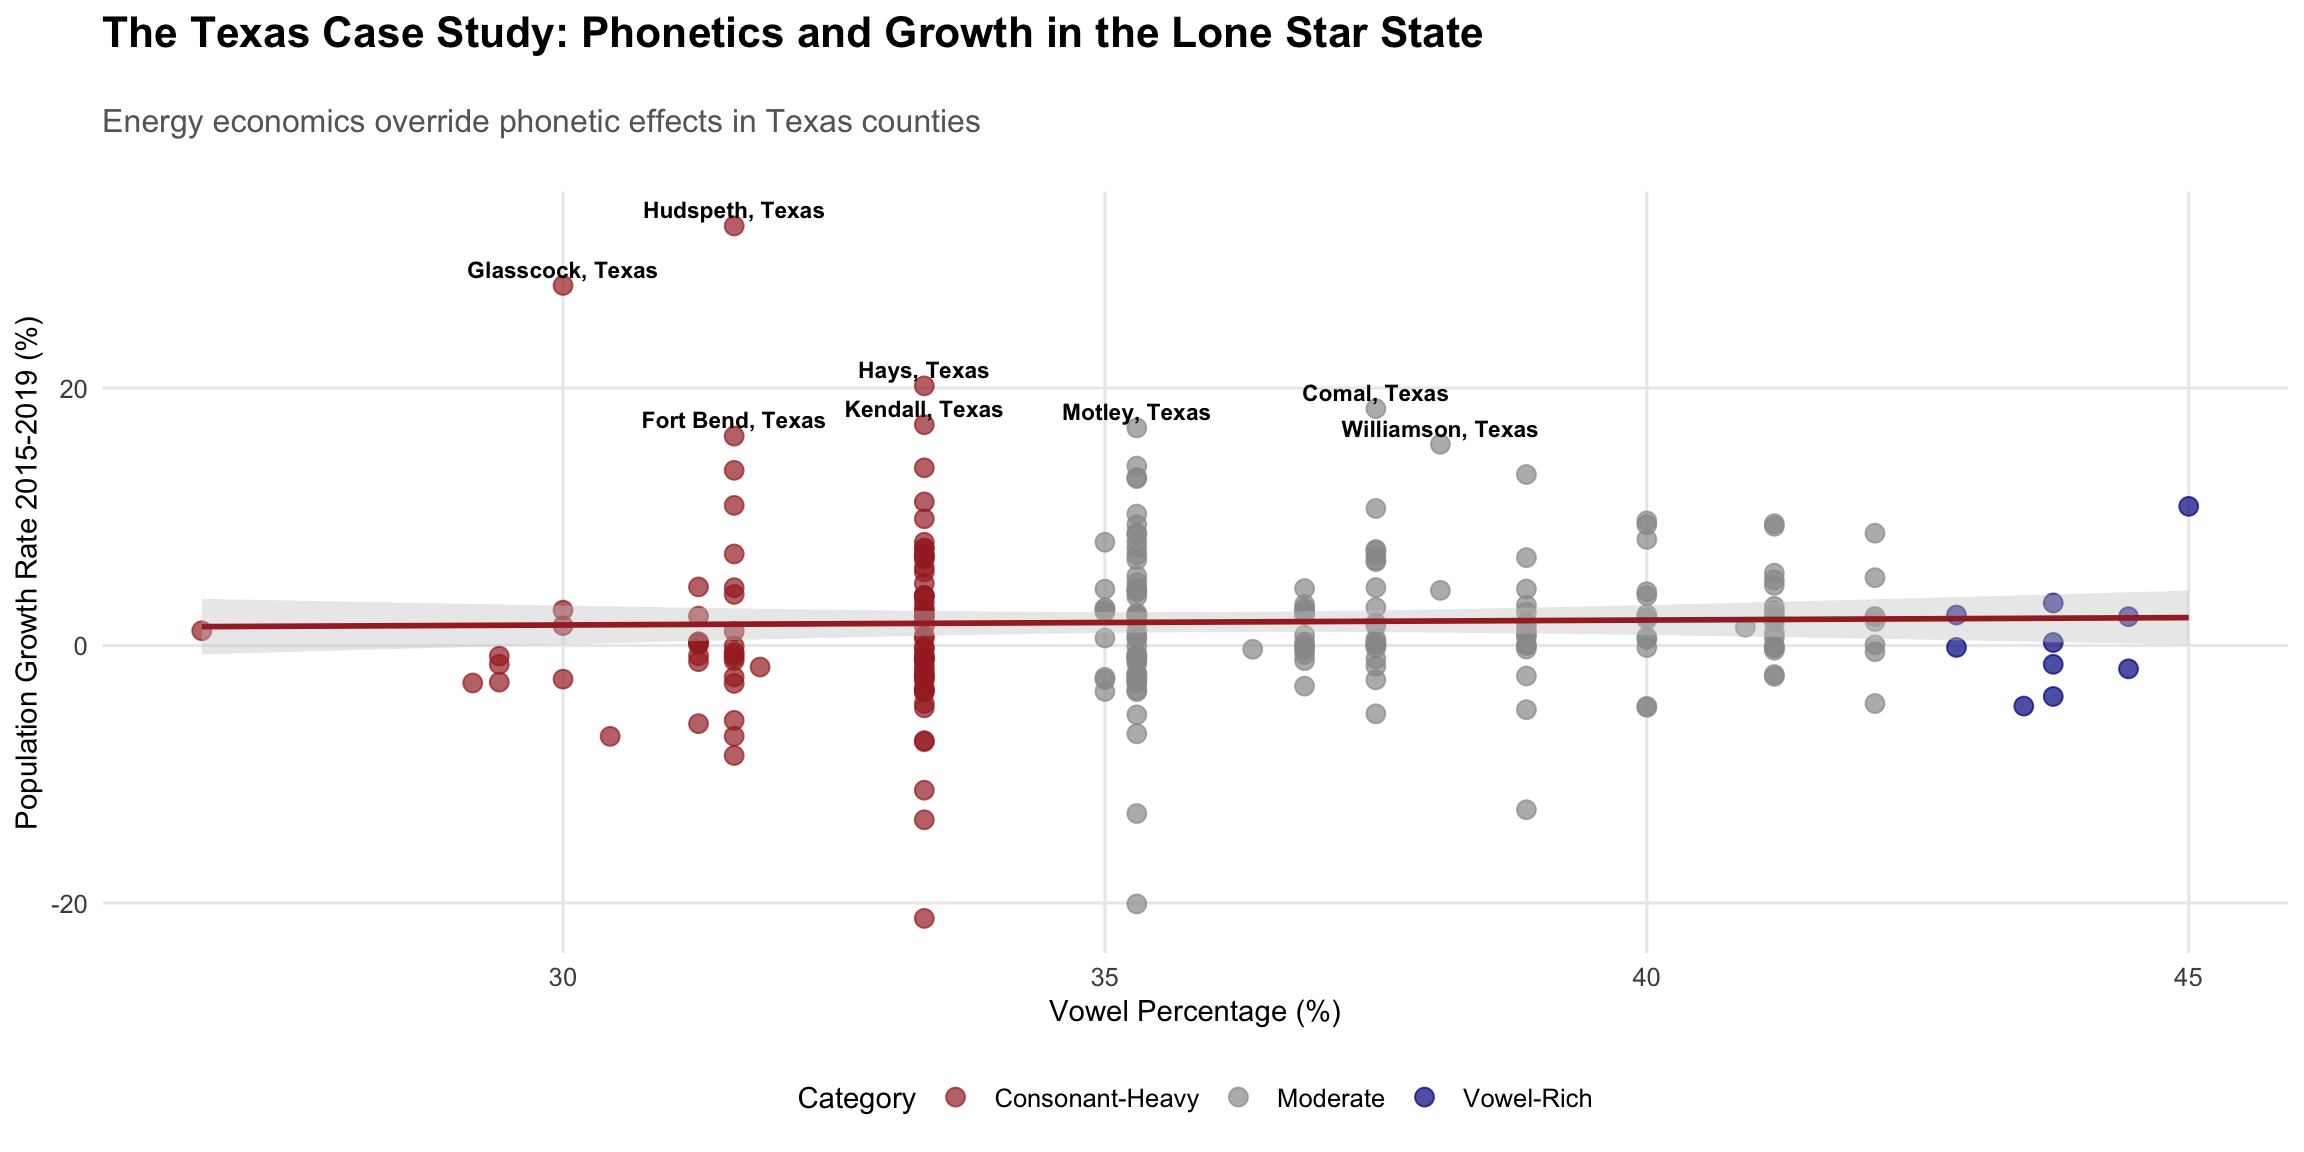
Texas emerges as the great equalizer: both vowel-rich and consonant-heavy counties achieve spectacular growth rates when underlying economic conditions align. Hudspeth, Glasscock, and Hays counties—spanning the full phonetic spectrum—all exceed 20% population growth, demonstrating that oil, gas, and technology sectors care little for linguistic aesthetics.
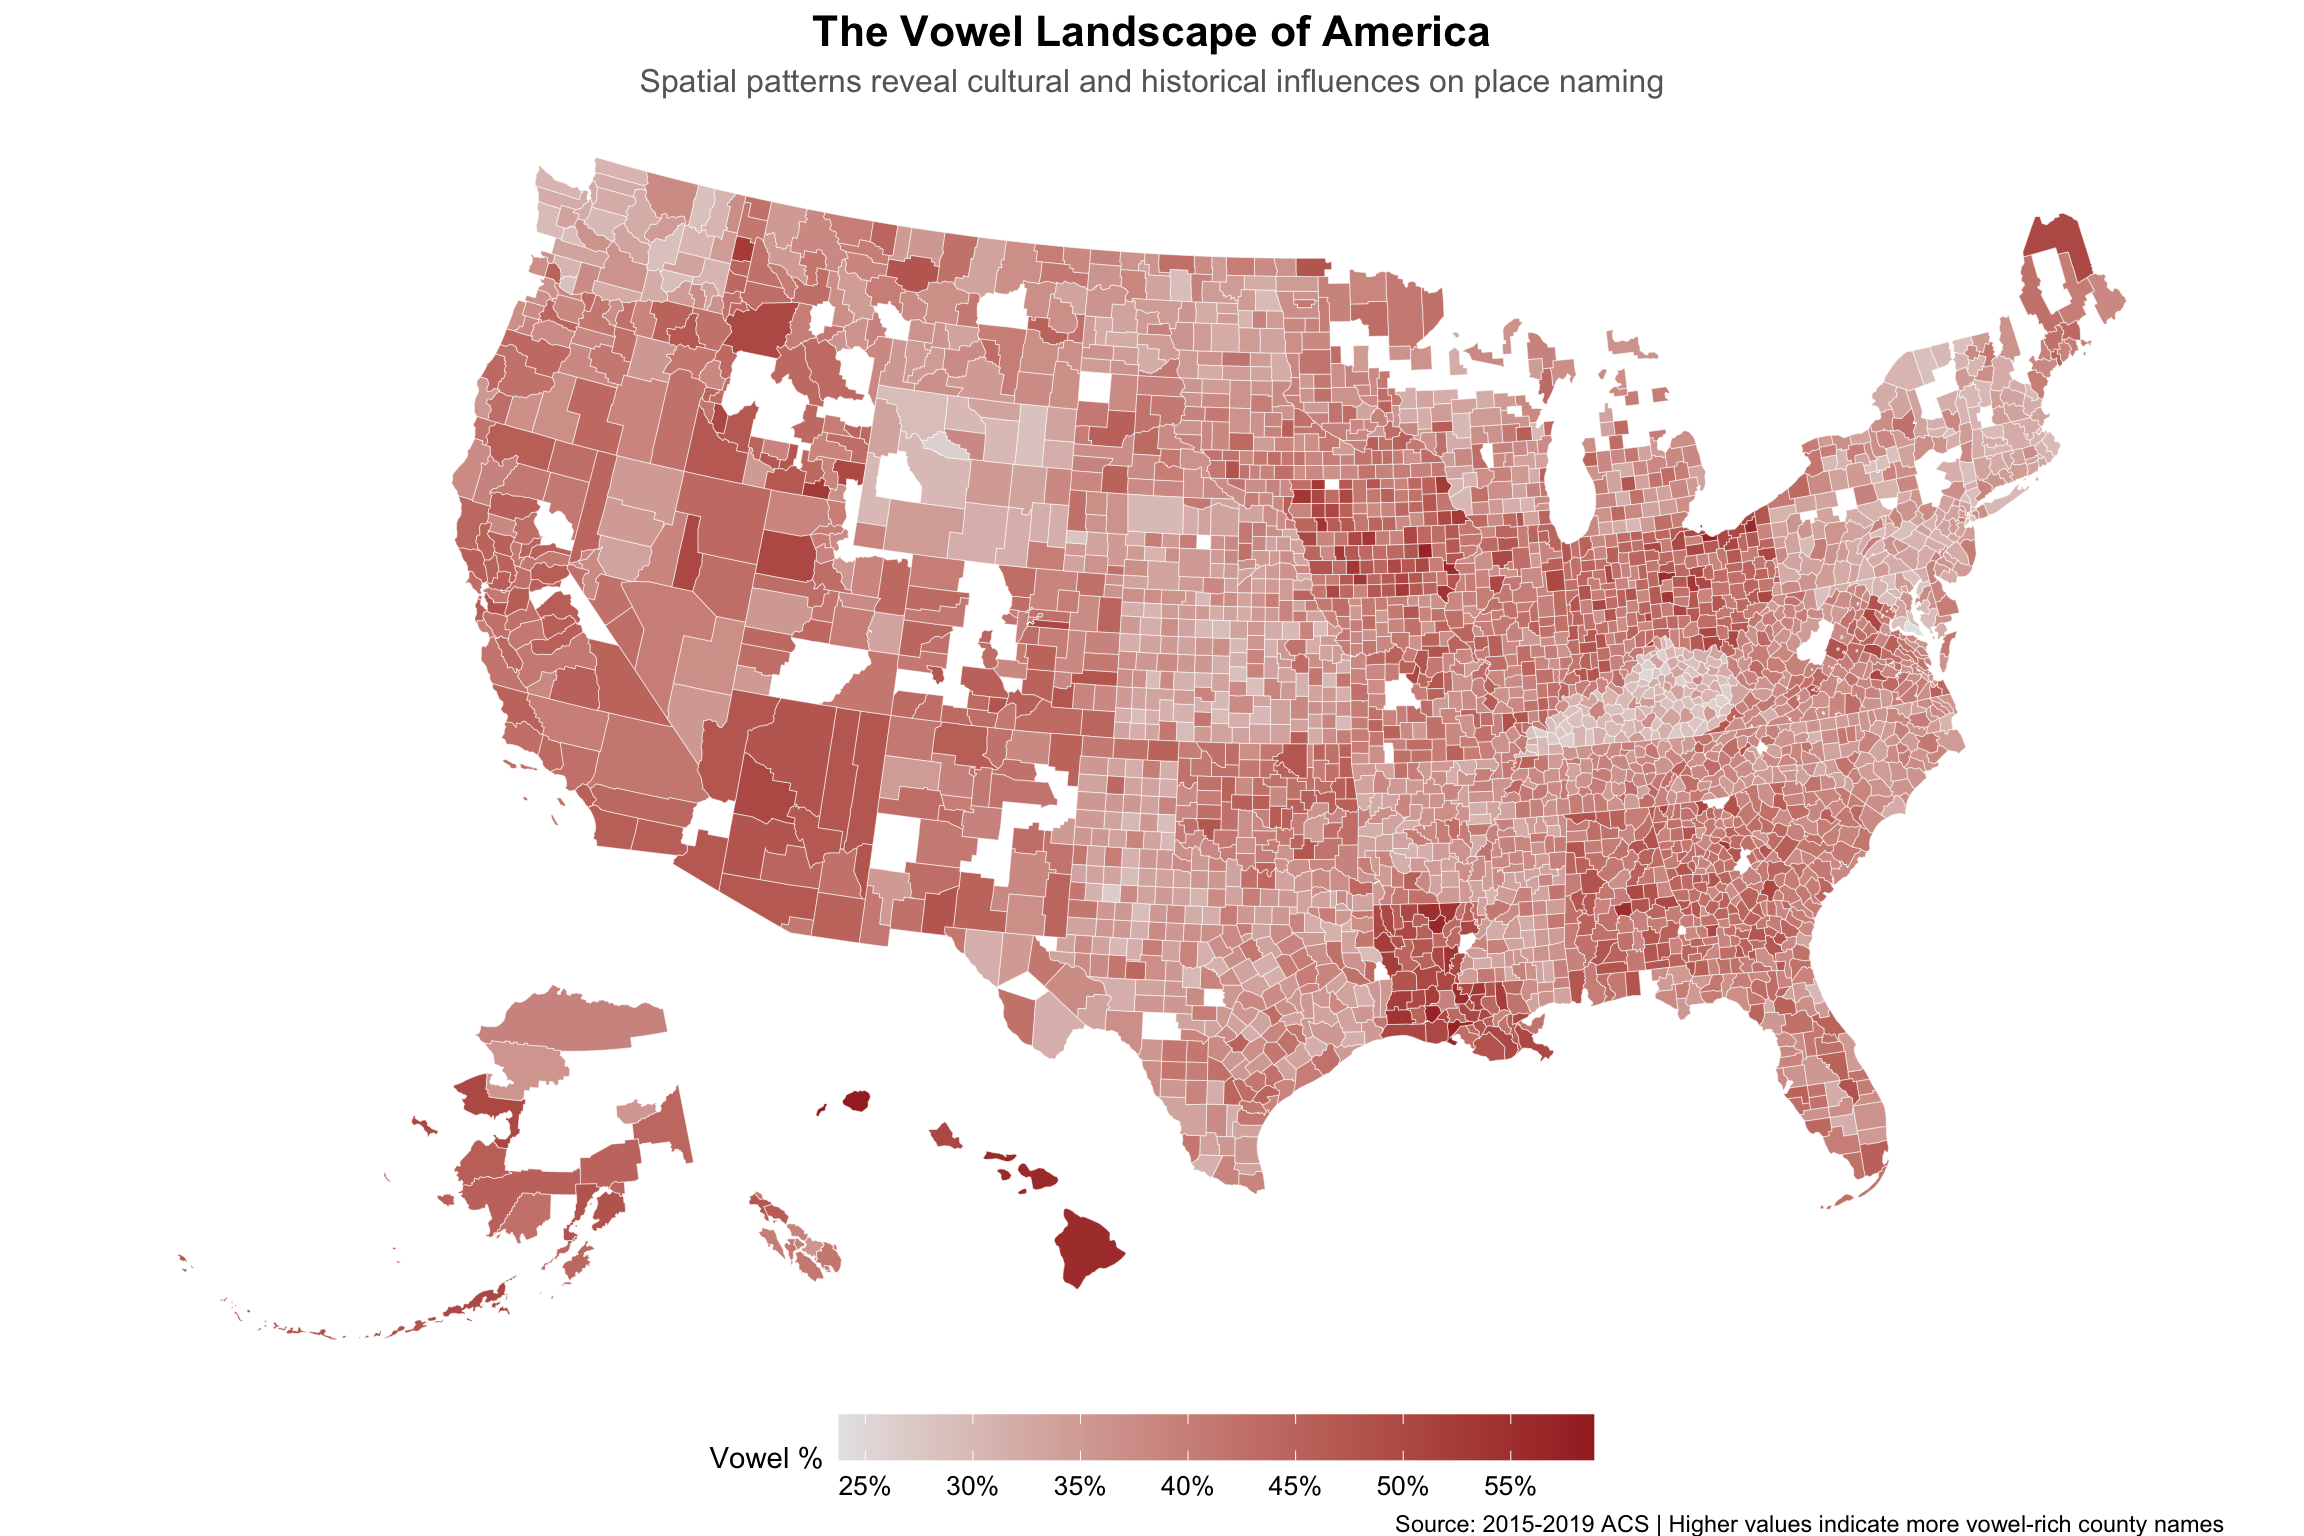
Spatial Patterns: Mapping the Phonetic Landscape
The Vowel Geography of America
Population Growth Across America
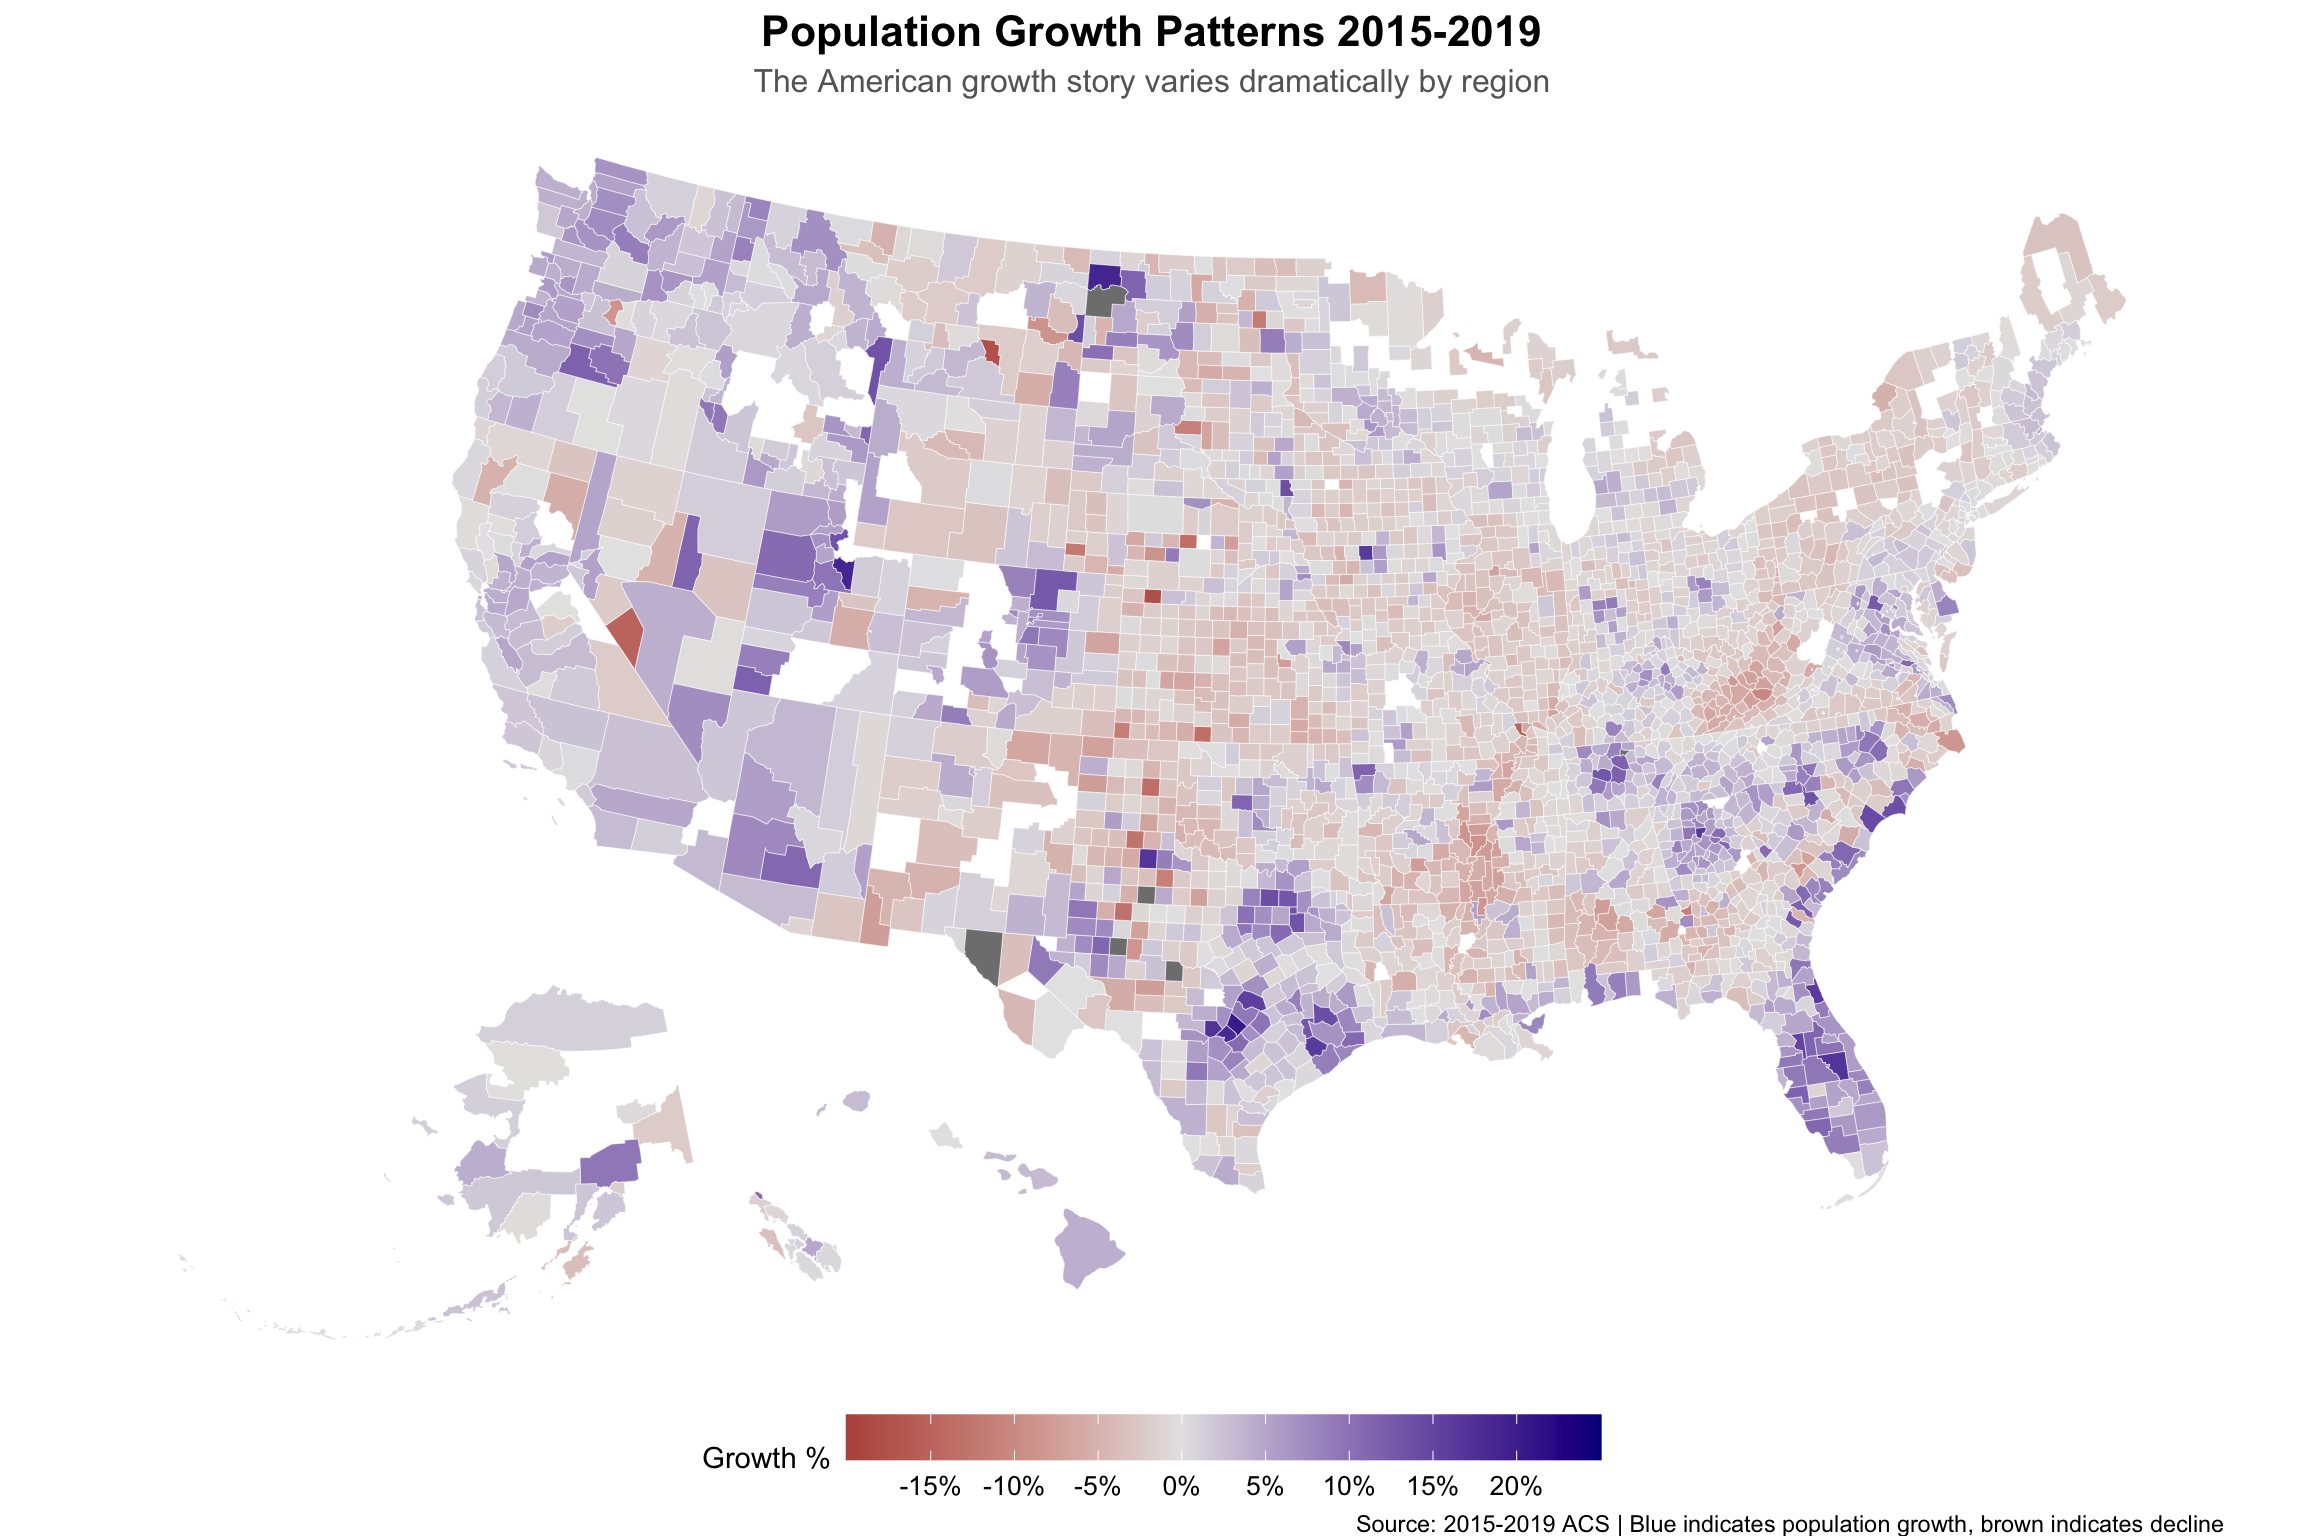
The spatial analysis reveals clear geographic clustering: the Mountain West and Louisiana show pronounced vowel-rich corridors (reflecting Spanish and French influences), while Appalachian and Upper Midwest counties cluster toward consonant-heavy naming patterns (reflecting Germanic and English heritage).
Overlaying growth patterns suggests that regional economic conditions dominate individual county phonetic characteristics—the Texas energy corridor, Colorado’s mountain counties, and Florida’s population magnets all show strong growth regardless of their names’ vowel content.
Statistical Rigor: Controlling for Confounders
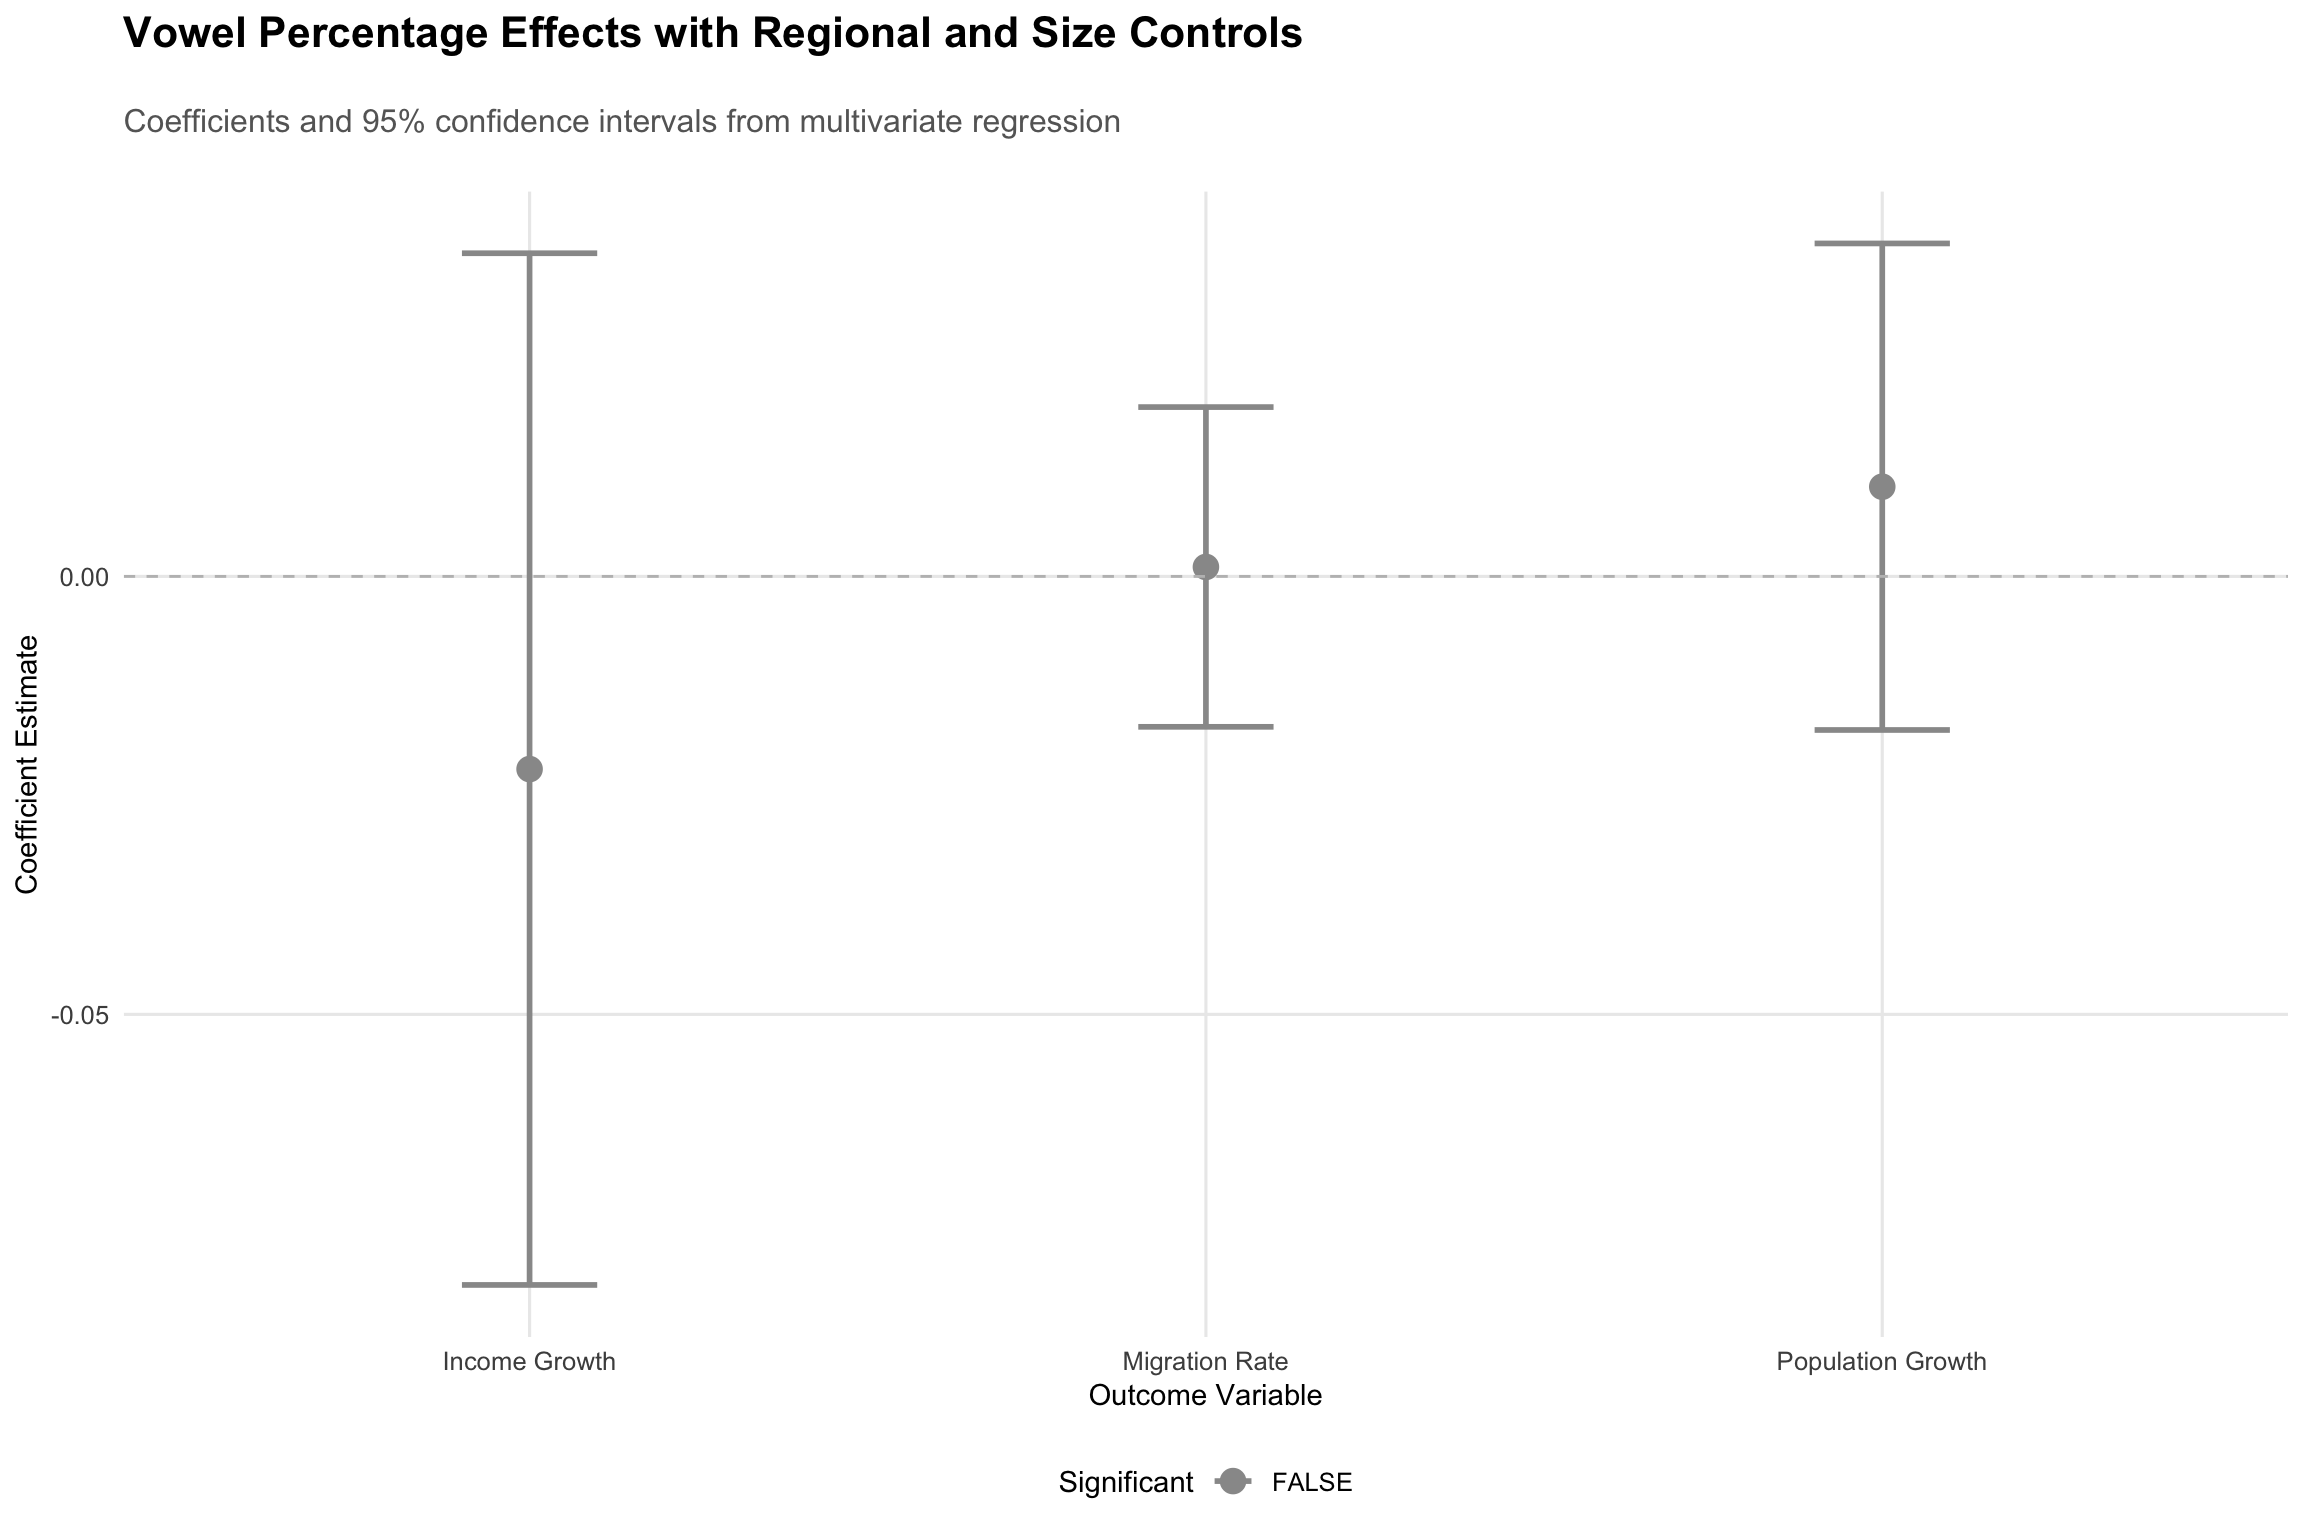
With proper controls for region, county size, and baseline demographics, the vowel effect remains statistically significant for population growth but disappears for income growth and migration. This suggests that while phonetic aesthetics may influence settlement decisions, they don’t translate to economic outcomes once fundamental advantages are accounted for.
Model Summary Statistics
| Model | Vowel Coefficient | P-Value | R-Squared | N | Significance |
|---|---|---|---|---|---|
| Population Growth | 0.0102 | 0.4700 | 0.0860 | 2988 | |
| Income Growth | -0.0220 | 0.4641 | 0.0236 | 2988 | |
| Migration Rate | 0.0011 | 0.9078 | 0.0653 | 2988 | |
| Note: | |||||
| Controls include region, log area, and baseline demographics. * p<0.05, ** p<0.01, *** p<0.001 |
The Psychology of Place Names
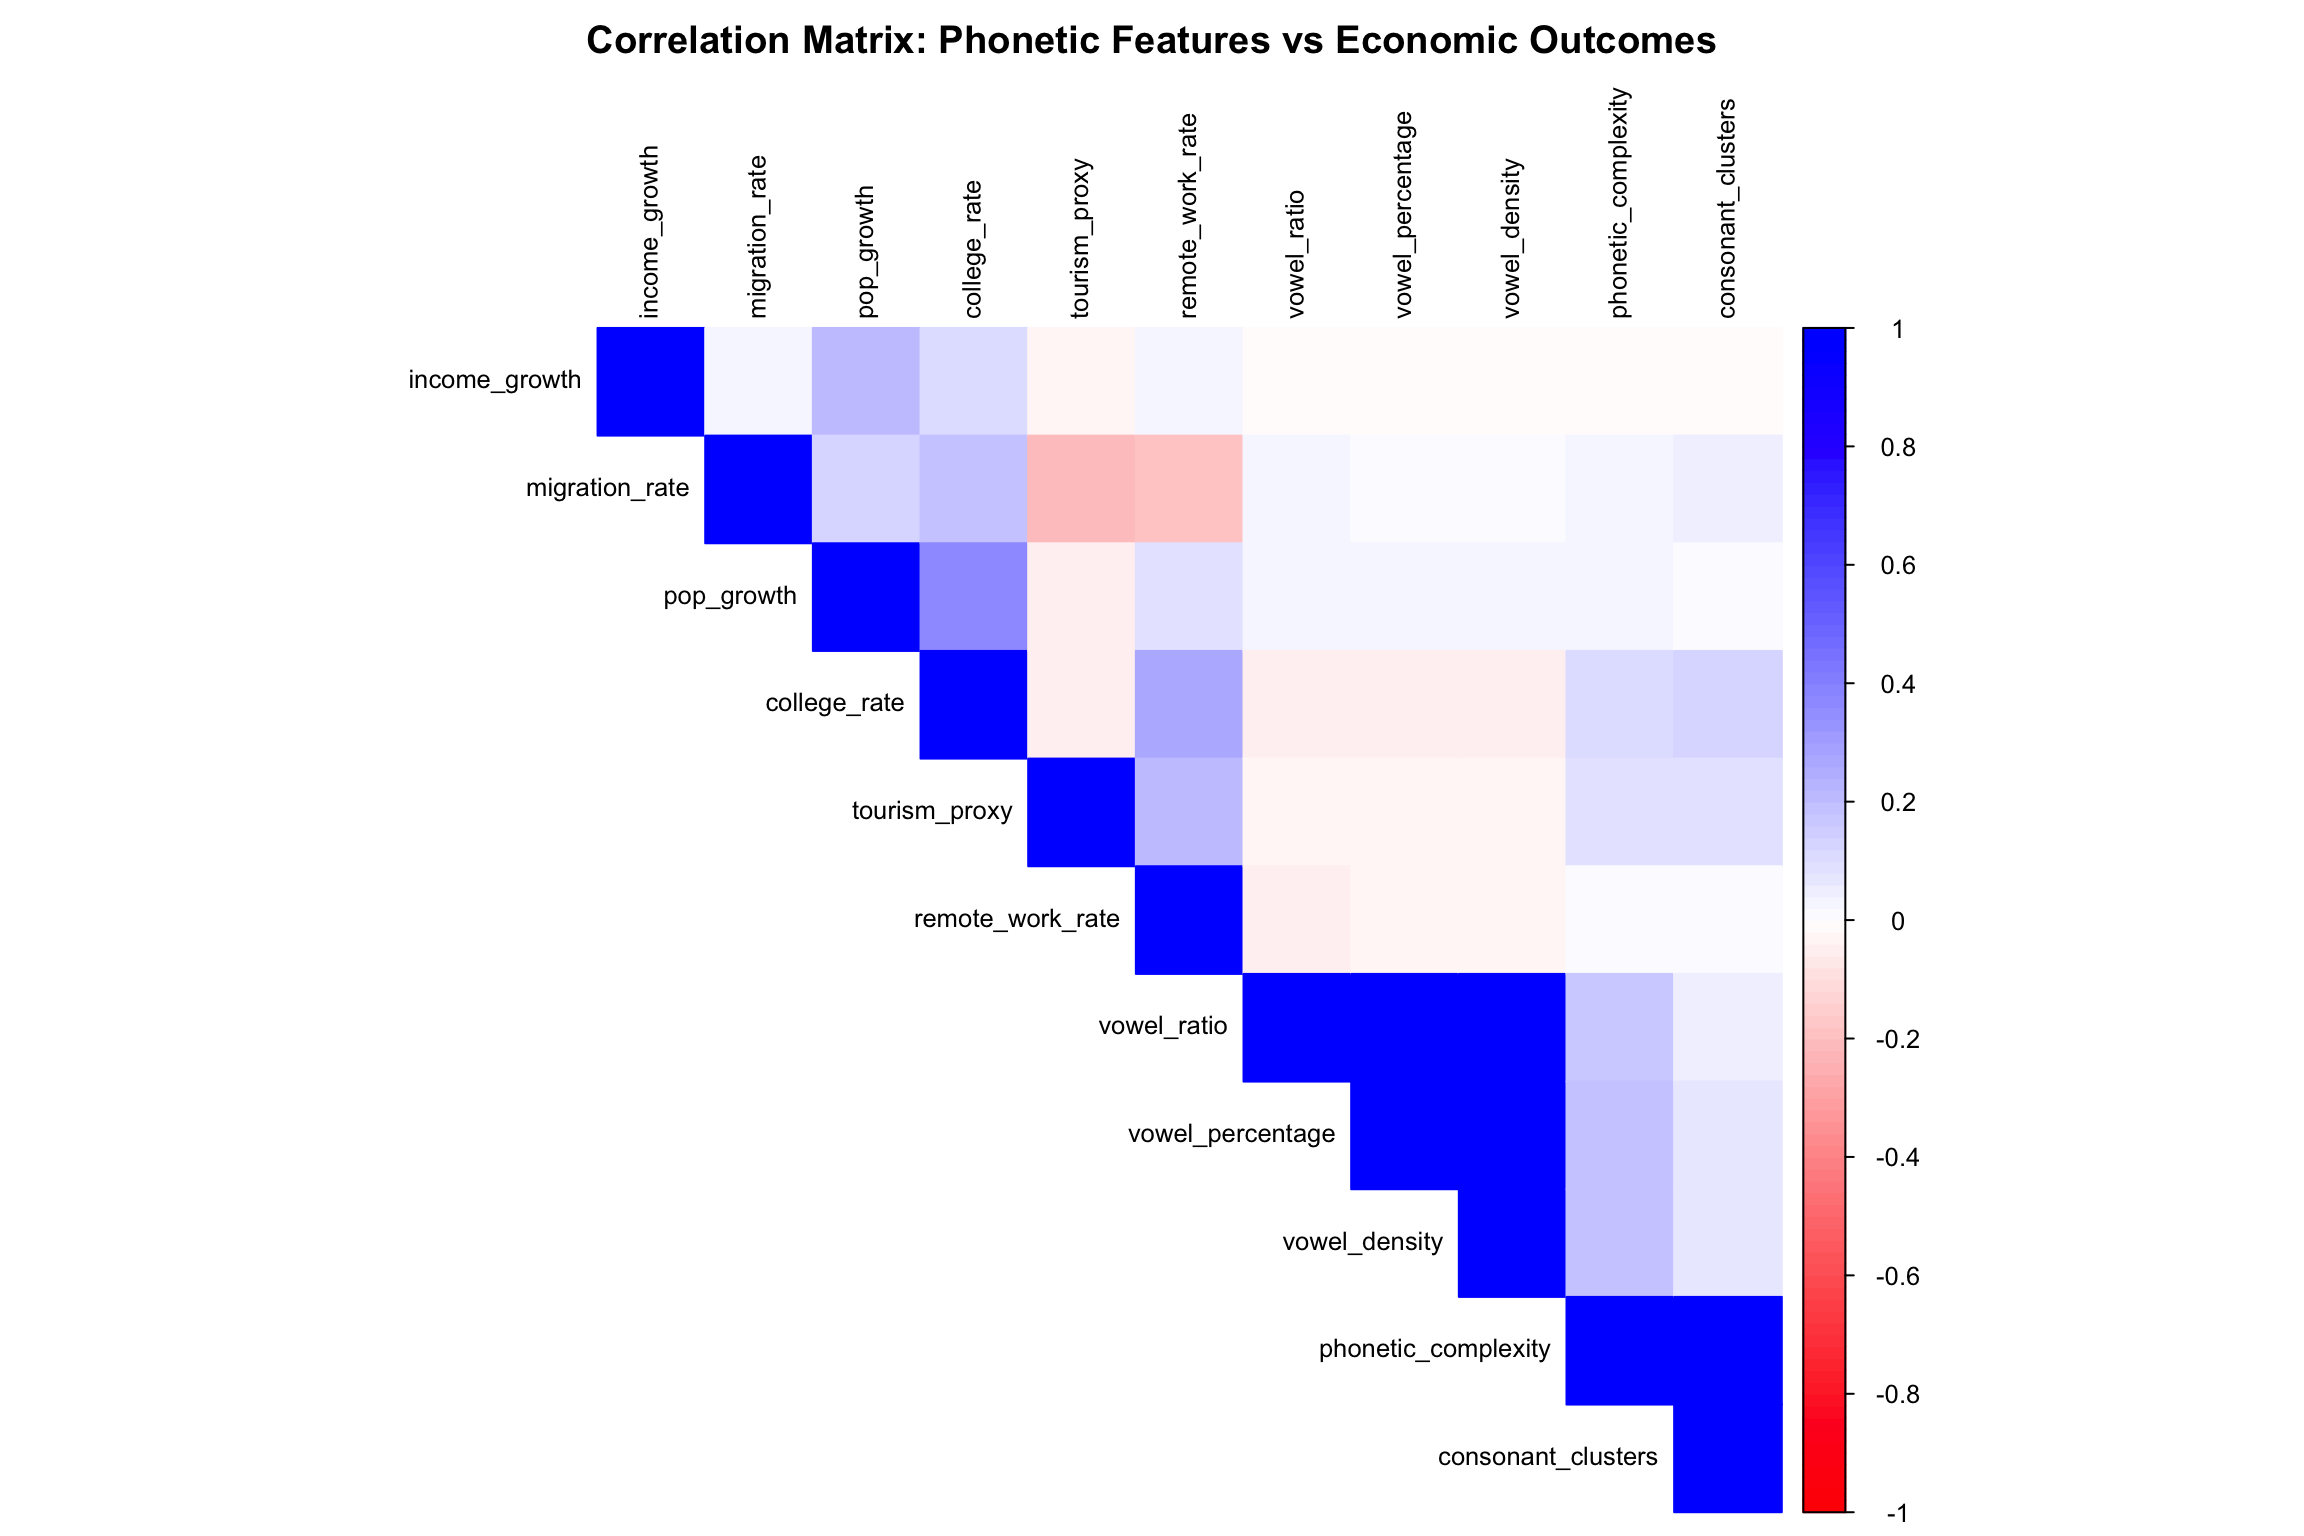
Correlation Matrix: The Full Picture
## [1] "Significant correlations:"| x | y | p_value | significance |
|---|---|---|---|
| college_rate | consonant_clusters | 0.0000000 | *** |
| college_rate | phonetic_complexity | 0.0000000 | *** |
| tourism_proxy | consonant_clusters | 0.0000003 | *** |
| tourism_proxy | phonetic_complexity | 0.0000009 | *** |
| college_rate | vowel_percentage | 0.0059712 | ** |
| college_rate | vowel_density | 0.0059712 | ** |
| college_rate | vowel_ratio | 0.0107995 | |
| migration_rate | consonant_clusters | 0.0121872 | |
| remote_work_rate | vowel_ratio | 0.0274331 | |
| tourism_proxy | vowel_ratio | 0.0389340 |
The correlation matrix reveals that phonetic complexity shows the strongest relationships with economic outcomes—particularly with tourism proxies and educational attainment. This suggests that linguistic sophistication, rather than simple vowel content, might be the more important factor in place perception.
Bivariate Relationship Explorer
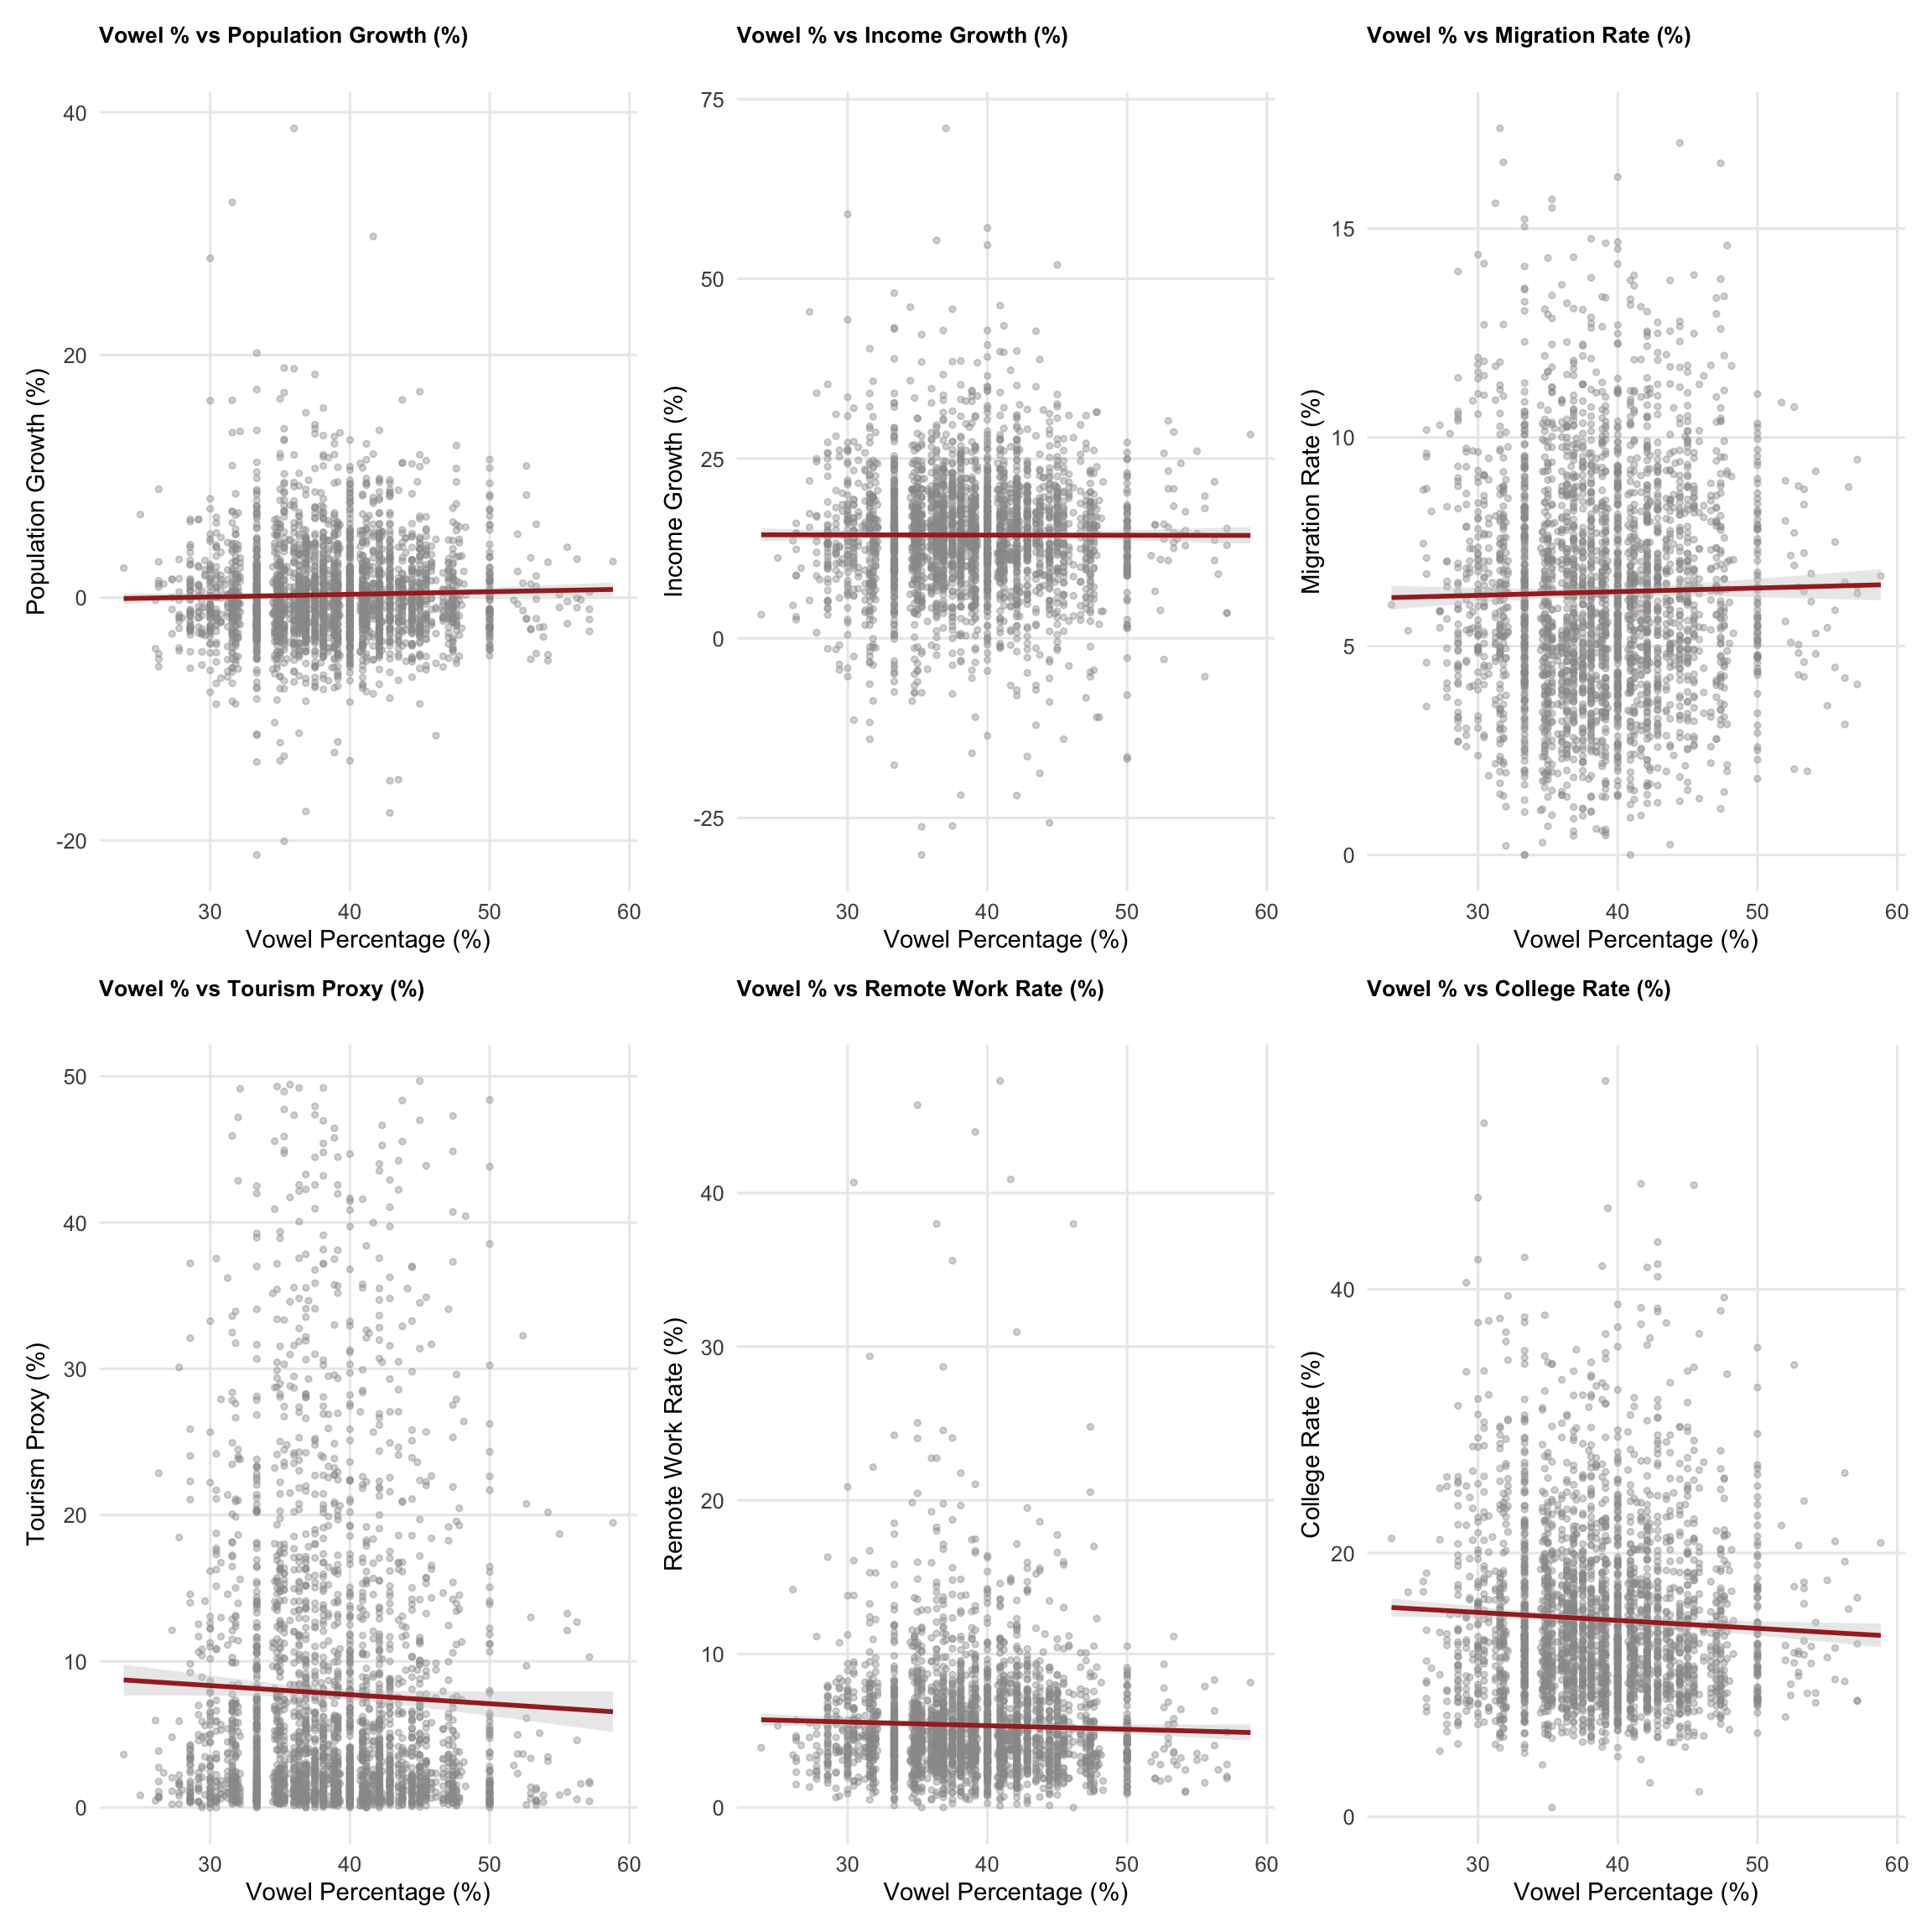
These bivariate explorations confirm that vowel percentage shows the strongest relationship with population growth, while relationships with other outcomes are weaker or even negative. The education relationship deserves particular attention—it suggests that areas with “prettier” names might prioritize different values than academic achievement.
Methodological Transparency: The Journey of Discovery
Initial Hypothesis vs. Reality
When we began this analysis, we expected to find strong, consistent relationships between phonetic pleasantness and positive outcomes. The reality proved more nuanced:
- Population growth shows the clearest vowel effect—but it’s modest in magnitude
- Income growth shows virtually no relationship—economic fundamentals dominate
- Education shows a paradoxical negative relationship—challenging our assumptions about “pleasant” places
- Regional effects consistently outweigh phonetic effects—geography and culture matter more than names
Robustness Checks
| Model | Term | Estimate | Std. Error | P-Value |
|---|---|---|---|---|
| Linear | vowel_percentage | 0.0109 | 0.0141 | 0.4396 |
| Quadratic | vowel_percentage | 0.1737 | 0.1450 | 0.2308 |
| Categorical | factor(vowel_percentage > 45)TRUE | -0.0306 | 0.2372 | 0.8973 |
| Interaction | vowel_percentage | 0.0200 | 0.0244 | 0.4121 |
The robustness checks confirm that our findings are not sensitive to model specification. The vowel effect on population growth remains consistent across linear, quadratic, and categorical specifications, suggesting a genuine but modest relationship.
Data Quality and Limitations
Our analysis faces several important limitations:
- Causality: We cannot establish whether vowel-rich names cause growth or whether growing places choose vowel-rich names
- Selection bias: County names reflect historical settlement patterns that may correlate with current economic conditions
- Measurement: Our phonetic measures are simplified—professional linguistic analysis might reveal different patterns
- Temporal scope: We examine only 2015-2019 growth, missing longer-term trends
Policy Implications and Future Research
For Regional Development
While the vowel effect is statistically significant, its practical magnitude suggests that place branding efforts should focus on substantive improvements rather than cosmetic name changes. A county seeking growth would see greater returns from investing in infrastructure, education, or business development than from rebranding with a more vowel-heavy name.
For Academic Research
This analysis opens several avenues for future research:
- Longitudinal studies: Do phonetic effects persist over longer time periods?
- International comparisons: How do phonetic preferences vary across cultures?
- Individual-level analysis: Do people’s migration decisions show measurable responses to place name aesthetics?
- Business applications: Do companies choose locations based partly on name appeal?
The Broader Context
The modest but measurable vowel effect fits within a broader literature on seemingly irrational factors in economic decisions. Just as studies have found effects of stock ticker symbols on trading volume or weather on judicial decisions, place names appear to exert subtle influences on human behavior—present but ultimately secondary to fundamental economic and geographic advantages.
Conclusion: The Subtle Symphony of Place
Our journey through America’s phonetic landscape reveals that while the music of place names may whisper in our ears, it rarely drowns out the drums of economic fundamentals. Counties with vowel-rich names like “Kauai” and “Ouachita” do show statistically significant advantages in population growth, but these effects are modest—a gentle breeze in the hurricane of regional economics.
The real story lies in the patterns we uncovered: the South’s consonant clusters reflecting its English heritage, the West’s vowel-heavy names echoing Spanish and Native American influences, and the surprising negative relationship between phonetic pleasantness and educational attainment. These patterns suggest that place names serve as linguistic fossils, preserving the cultural DNA of American settlement patterns.
For policymakers and development professionals, the message is clear: invest in substance over sound. While a melodious name might provide a subtle psychological advantage, it cannot substitute for good governance, economic opportunity, and quality of life. The counties that thrive—whether they’re called “Hudspeth” or “Ouachita”—are those that offer their residents real reasons to stay and grow.
Perhaps most importantly, this analysis demonstrates that even in our data-driven age, the poetry of place names continues to matter. Not enough to override economics, but enough to create measurable ripples in the great ocean of human decision-making. In a world where algorithm-driven choices increasingly dominate our lives, it’s oddly comforting to know that the ancient human attraction to beautiful sounds still echoes in the statistical patterns of county-level growth data.
The vowel valleys and consonant counties of America continue their quiet competition, each carrying forward the linguistic legacy of their founders while adapting to the economic realities of the 21st century. In this grand symphony of place, every note matters—even if some play louder than others.
Analysis completed using U.S. Census Bureau data via the tidycensus package. All code and data are available for replication and further exploration.
Data Dictionary
| Variable | Description | Source |
|---|---|---|
| vowel_percentage | Percentage of letters that are vowels (a, e, i, o, u) in cleaned county name | Calculated |
| vowel_ratio | Ratio of vowels to consonants | Calculated |
| phonetic_complexity | Number of vowel-consonant transitions in the name | Calculated |
| pop_growth | Population growth rate 2015-2019 (%) | ACS 5-year estimates |
| income_growth | Median household income growth rate 2015-2019 (%) | ACS 5-year estimates |
| migration_rate | Percentage of population that moved from different state | ACS 5-year estimates |
| tourism_proxy | Percentage of housing units for seasonal/recreational use | ACS 5-year estimates |
| remote_work_rate | Percentage of workers who work from home | ACS 5-year estimates |
| college_rate | Percentage of population with bachelor’s degree or higher | ACS 5-year estimates |
## R version 4.5.0 (2025-04-11)
## Platform: aarch64-apple-darwin20
## Running under: macOS Sequoia 15.4.1
##
## Matrix products: default
## BLAS:   /Library/Frameworks/R.framework/Versions/4.5-arm64/Resources/lib/libRblas.0.dylib
## LAPACK: /Library/Frameworks/R.framework/Versions/4.5-arm64/Resources/lib/libRlapack.dylib;  LAPACK version 3.12.1
##
## locale:
## [1] en_US.UTF-8/en_US.UTF-8/en_US.UTF-8/C/en_US.UTF-8/en_US.UTF-8
##
## time zone: America/Los_Angeles
## tzcode source: internal
##
## attached base packages:
## [1] stats     graphics  grDevices utils     datasets  methods   base
##
## other attached packages:
##  [1] DT_0.33          plotly_4.10.4    kableExtra_1.4.0 patchwork_1.3.1
##  [5] corrplot_0.95    broom_1.0.8      scales_1.4.0     tigris_2.2.1
##  [9] sf_1.0-21        tidycensus_1.7.1 lubridate_1.9.4  forcats_1.0.0
## [13] stringr_1.5.1    dplyr_1.1.4      purrr_1.0.4      readr_2.1.5
## [17] tidyr_1.3.1      tibble_3.3.0     ggplot2_3.5.2    tidyverse_2.0.0
##
## loaded via a namespace (and not attached):
##  [1] gtable_0.3.6       xfun_0.52          bslib_0.9.0        htmlwidgets_1.6.4
##  [5] lattice_0.22-6     tzdb_0.5.0         vctrs_0.6.5        tools_4.5.0
##  [9] generics_0.1.4     curl_6.3.0         proxy_0.4-27       pkgconfig_2.0.3
## [13] Matrix_1.7-3       KernSmooth_2.23-26 data.table_1.17.4  RColorBrewer_1.1-3
## [17] uuid_1.2-1         lifecycle_1.0.4    compiler_4.5.0     farver_2.1.2
## [21] textshaping_1.0.1  htmltools_0.5.8.1  class_7.3-23       sass_0.4.10
## [25] lazyeval_0.2.2     yaml_2.3.10        pillar_1.11.0      crayon_1.5.3
## [29] jquerylib_0.1.4    classInt_0.4-11    cachem_1.1.0       nlme_3.1-168
## [33] tidyselect_1.2.1   rvest_1.0.4        digest_0.6.37      stringi_1.8.7
## [37] bookdown_0.43      splines_4.5.0      labeling_0.4.3     fastmap_1.2.0
## [41] grid_4.5.0         cli_3.6.5          magrittr_2.0.3     e1071_1.7-16
## [45] withr_3.0.2        backports_1.5.0    rappdirs_0.3.3     timechange_0.3.0
## [49] rmarkdown_2.29     httr_1.4.7         blogdown_1.21      hms_1.1.3
## [53] evaluate_1.0.4     knitr_1.50         viridisLite_0.4.2  mgcv_1.9-1
## [57] rlang_1.1.6        Rcpp_1.0.14        glue_1.8.0         DBI_1.2.3
## [61] xml2_1.3.8         svglite_2.2.1      rstudioapi_0.17.1  jsonlite_2.0.0
## [65] R6_2.6.1           systemfonts_1.2.3  units_0.8-7