What does it mean to be “normal”?
Consider for a moment the quintessential Canadian city. What does that image in your head look like? Are there outdoor rinks, wheat fields, and abundant Timmies? Does your mental image include a yoga studio, a dispensary, and a third-wave coffee shop? Canadians like to celebrate a self-constructed identity of diversity-the cultural mosaic- that is punctuated with conspicuous Canadiana that binds everything together. Canada is a highly urbanized country—it is a nation of cities, and while every Canadian city has elements that scream “Canada!”, is there a city that can stand above the rest and definitely claim to be the most quintessentially Canadian city of them all?
One way of approaching a question like this would be to define some kind of criteria that best represents this Canadian essence—but that would be hard and, truthfully, rather icky. The idea of the “normal” place is a common rhetorical approach often used to conjure up an image of a majority-dominant heartland that truly represents the values of a country. You can see this in politics all the time: cities are more diverse and heterogeneous than rural places, and, in many industrialized countries, account for the majority of the population, but are seldom viewed as representative of a country’s characteristics.
A more data-driven approach
So instead of a selecting for some arbitrary characteristics that define what the Canadian “normal” is, let’s take a data-driven approach. Fortunately, this FiveThirtyEight article by the economist Jed Kolko looking at identifying the most “normal” place in America provides a good template to start. The motivation behind the FiveThirtyEight article is simple: there is a disconnect between what pundits and some politicians view as representative of a “normal America” and what actual demographics say. The most “normal” place in America is not Oshkosh, Wisconsin but New Haven, Connecticut. Kolko’s approach is pretty simple as it relies on a quantitative analysis of demographics across US metros using age, education, and race as key indicators.
We can do something similar using Canadian data. While we lack the crosstabs across Census values to apply the exact same methodology, a roughly similar approach can be taken by calculating the proportion or incidence of selected Census demographic or behavioral values for a given place and comparing it to a national benchmark. The cumulative sum of the geometric distance between the values for the national rate and that of the selected place provides an indication of similarity or dissimilarity. The most “normal” city in Canada will be the city that has the most similar demographic and characteristic makeup to the national benchmark.
The demographic mix
While the FiveThirtyEight article looks at age, education, and race only, we have the entire range of Canadian Census values to work with. This distinction is important because the result of any similarity calculation like the one in this post will depend on the variables that are selected. Using all available Census variables is not feasible, but we can go beyond age, education, and visible minority groups to also include immigration status, household tenure type, and commute types to capture some additional indicators that define how a city looks and feels.
The most “normal” places in Canada
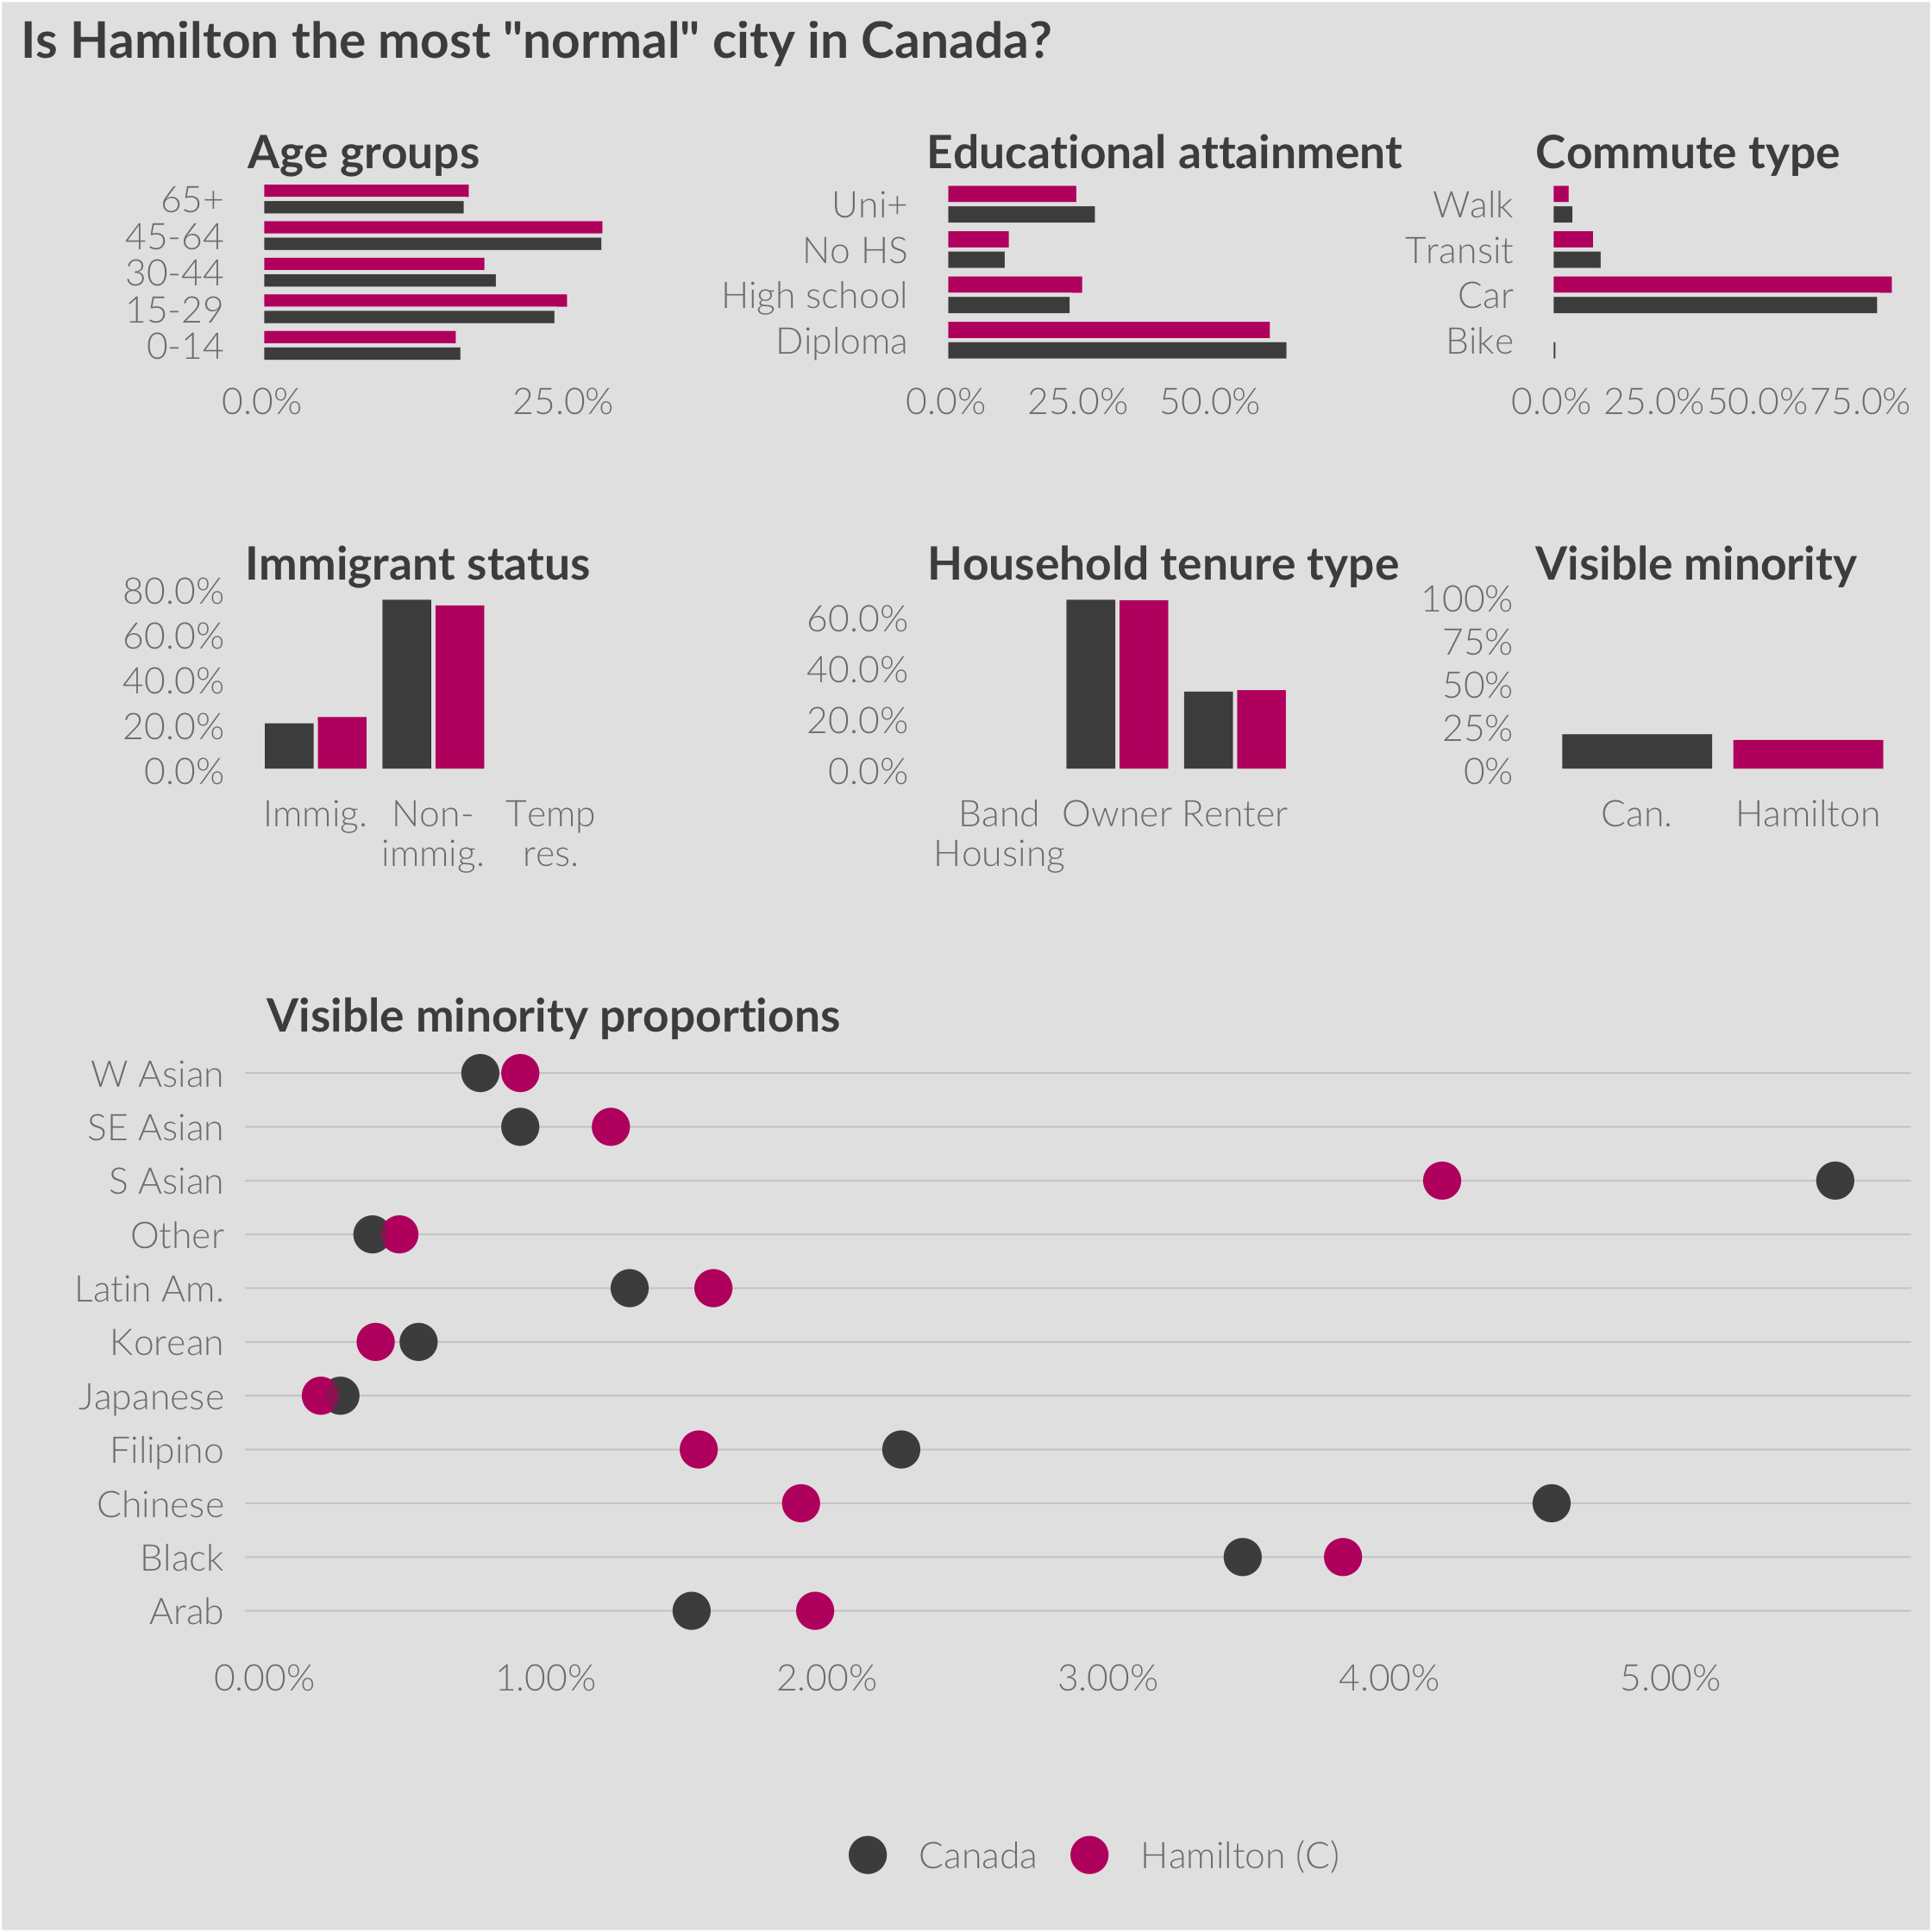
Using geometric distances between demographic and characteristic compositions the most “normal” or most representative municipality in Canada is Hamilton, Ontario. Guelph, London, Winnipeg, and Kitchener round out the bottom five.
Model of a modern Canadian city
 Photograph of downtown Hamilton, Ontario taken from Sam Lawrence Park, Wikipedia CC BY-SA 2.5
Hamilton has almost identical proportions to Canada as a whole for almost every variable looked at in calculating the score. Like Canada overall, the majority of the population falls into either the 45-64 or 15-29 groups that represent the Boomer and Millennial mega-generations. Educational attainment similar with the majority of people living in Canada possessing a post-secondary diploma below a university degree. The individual proportions of visible minority groups is remarkably similar as almost every group has a share of the population that falls within 1% of the national proportion.
Compare this with the city of Vancouver, which drastically differs from the national averages across all categories. Vancouver has fewer children under 15, more university educated people, a far higher incidence of renters and immigrants, and a far lower incidence of commuting by car.
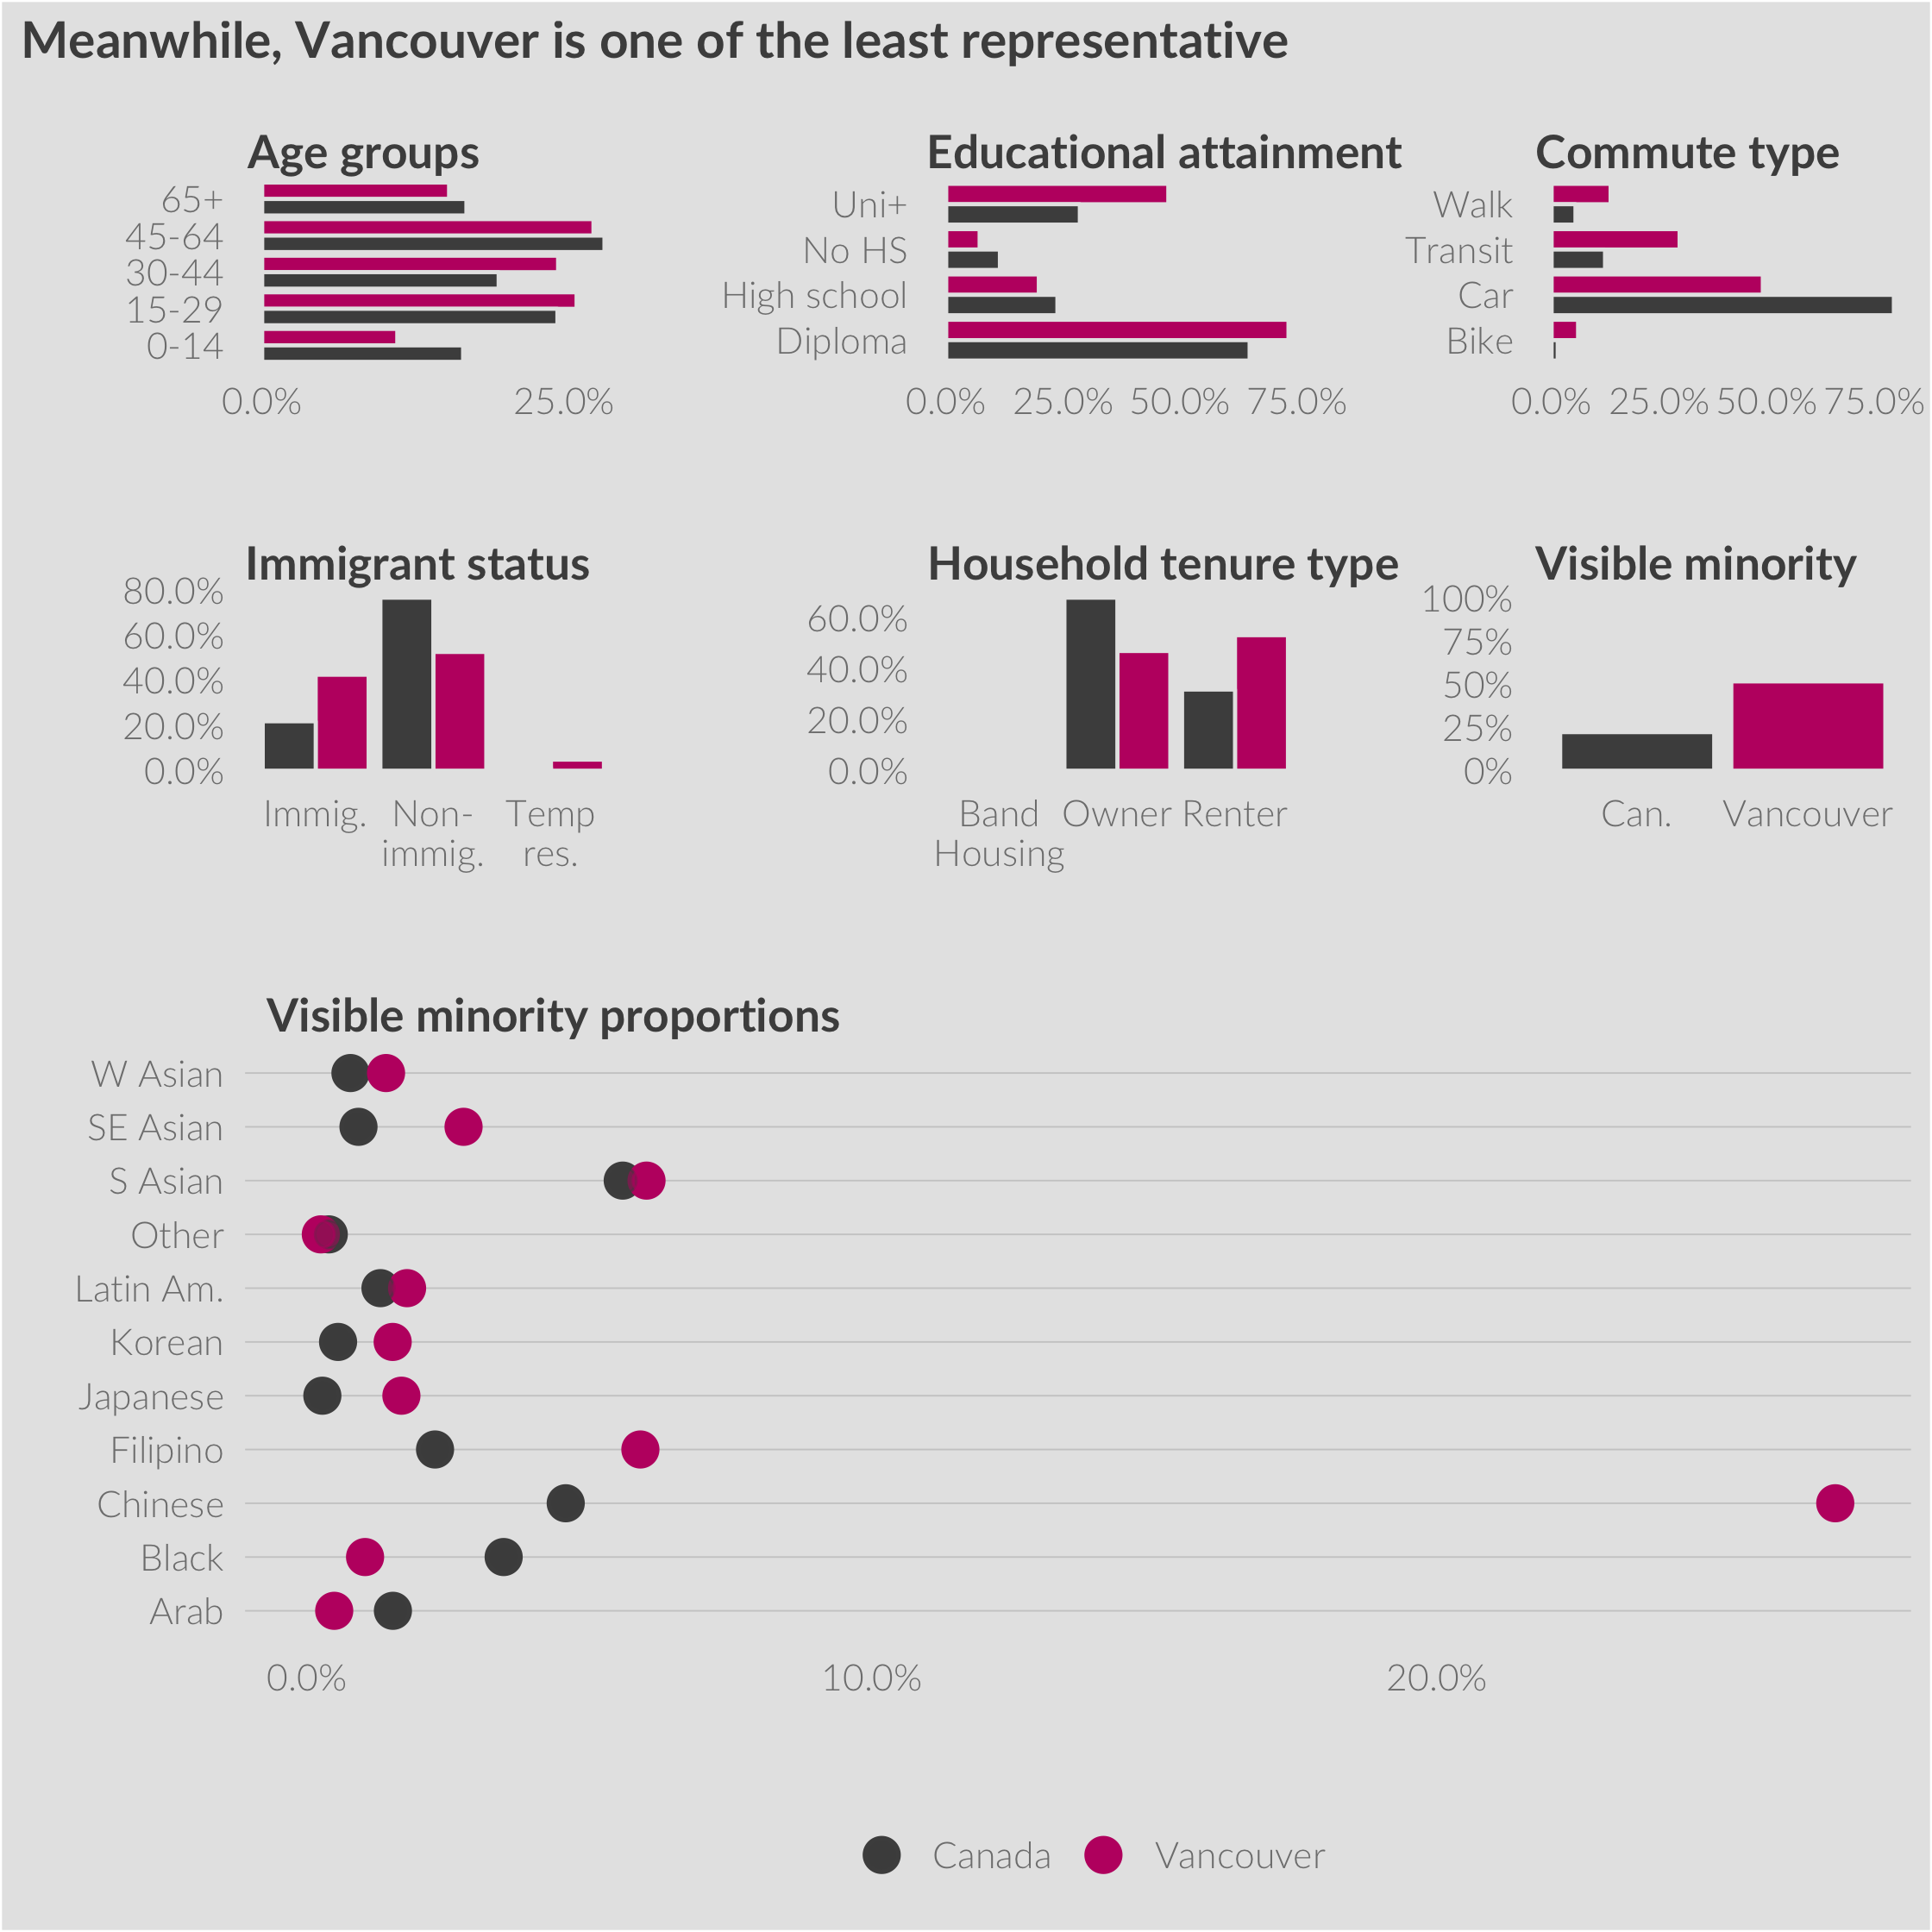
Canada’s major population centres: the GTA, Montreal, and the Lower Mainland all tend to have a higher educational attainment, different commuting patterns, more renters, and much more visible diversity. Because these few metropolitan regions account for so much of the national population, they will skew the national rates to reflect these differences.
Of the most similar cities on the list, the first 9 municipalities all have larger populations. If the objective is to find the definitive small Canadian town with the demographic mix that best represents the country and is not within the immediate geographic influence of a larger metropolitan area, you have to wait to the 24-th ranked city on the list, Brandon, MB.
Code
The full code for this analysis is available on GitHub. The analysis uses the cancensus package for retrieving Census data.